Följ oss

Nyheter

Gold Consolidates Amid Late Summer Doldrums

Publicerad

den

Market Review - Gold Consolidates Amid Late Summer Doldrums. The late summer period of August into September is shaping up to be a period of consolidation for gold markets. This follows the strong 28.5% year-to-date gain in the gold price as of July 6, which represented a two-year high. Gold equities reached a new three-year high on August 12 having climbed 127.6%, as measured by the NYSE Gold Miners Index1 (GDMNTR). In late August, however, the gold sector cooled off, and gold prices declined $42.03 per ounce (3.1%) for the month, while the GDMNTR fell 16.2% and the MVIS™ Global Junior Gold Miners Index2 (MVGDXJTR) declined 15.9%.

Market Review – Gold Consolidates Amid Late Summer Doldrums. The late summer period of August into September is shaping up to be a period of consolidation for gold markets. This follows the strong 28.5% year-to-date gain in the gold price as of July 6, which represented a two-year high. Gold equities reached a new three-year high on August 12 having climbed 127.6%, as measured by the NYSE Gold Miners Index1 (GDMNTR). In late August, however, the gold sector cooled off, and gold prices declined $42.03 per ounce (3.1%) for the month, while the GDMNTR fell 16.2% and the MVIS™ Global Junior Gold Miners Index2 (MVGDXJTR) declined 15.9%.

The summer doldrums came late this year for gold and gold stocks. Now that the U.K. Brexit decision is old news, the markets are again obsessed with the Federal Reserve’s (the “Fed”) shifting stance on rate decisions. Although the Fed’s tone had been dovish on rate increases following the August 18 release of the Federal Open Market Committee (FOMC) minutes from its July 27 meeting, sentiment changed markedly just a week later following the Federal Reserve Bank of Kansas City’s annual symposium in Jackson Hole on August 26. The selling pressure actually started on August 24 ahead of the Jackson Hole meeting, when unusually heavy selling occurred in the gold futures market. We continue to be amazed (in a negative way) at the inconsistent shifts in the Fed’s guidance, its lack of leadership, and the damage this uncertainty must be causing to the economy. A speech by Federal Reserve Chairwoman Janet Yellen, followed by comments in the press by Vice Chairman Stanley Fischer, convinced the markets that a rate increase is now possible at the next Fed meeting on September 21. As a result, the U.S. dollar strengthened while gold, and especially gold shares, took a tumble.

Market Outlook

The Fed is now indicating that it might tighten monetary conditions with a rate increase either in September or in December after the upcoming presidential election. This is a questionable policy stance when GDP growth in the most recent quarter was just 1.1%, industry capacity utilization is low at just under 76%, worker productivity is in decline, and the last time the yield curve (2- to 10-year U.S. Treasuries) was this flat was in 2007. The jobless rate at 4.9% indicates near full employment, yet inflation remains subdued. The Fed has probably never tightened rates in past cycles with indicators so weak. In fact, at this point in the business cycle, a more normal stance would be to hold steady, looking ahead to a time when it might cut rates. Because of this, we believe any decision to raise rates in 2016 will ultimately be viewed as a misstep that increases financial and economic risks, and this will be to gold’s benefit.

In the meantime, however, the anticipation of a rate increase and any attendant U.S. dollar strength could cause gold to struggle. David Rosenberg of Gluskin Sheff3 characterizes this anticipated rate increase as the fourth scare of the cycle. The first was the “taper tantrum” in 2013, next came the end of quantitative easing (QE) in 2014, and then lastly, the actual interest rate increase in December 2015. Each of these episodes lasted no more than a few months with volatility and downward pressure on stocks, bonds, commodities, and emerging markets.

Another aspect of Janet Yellen’s Jackson Hole speech furthered our conviction for strong gold prices in the long term. She describes all of the unconventional monetary policies implemented since the financial crisis (e.g., zero rates, QE, etc.) as components of the Fed’s “toolkit”. Perhaps she is a fan of the 1974 Doobie Brothers classic song “What Were Once Vices are Now Habits”. These once radical monetary tools are now considered conventional, and she plans to use them in the future if deemed necessary. She also suggested the Fed may follow the examples set forth by the European Central Bank, Swiss National Bank, Bank of England, and Bank of Japan by purchasing corporate debt and/or equities as part of stimulus measures. Ms. Yellen virtually guarantees that the policies that we believe are creating asset bubbles, wealth disparities, and other market dislocations will persist indefinitely. If these fail to generate the desired growth, “helicopter money” (printing money to give directly to the Treasury) might be the next experiment. The risks and currency debasement that generally accompany these policies stands to be supportive of the gold price for the foreseeable future.

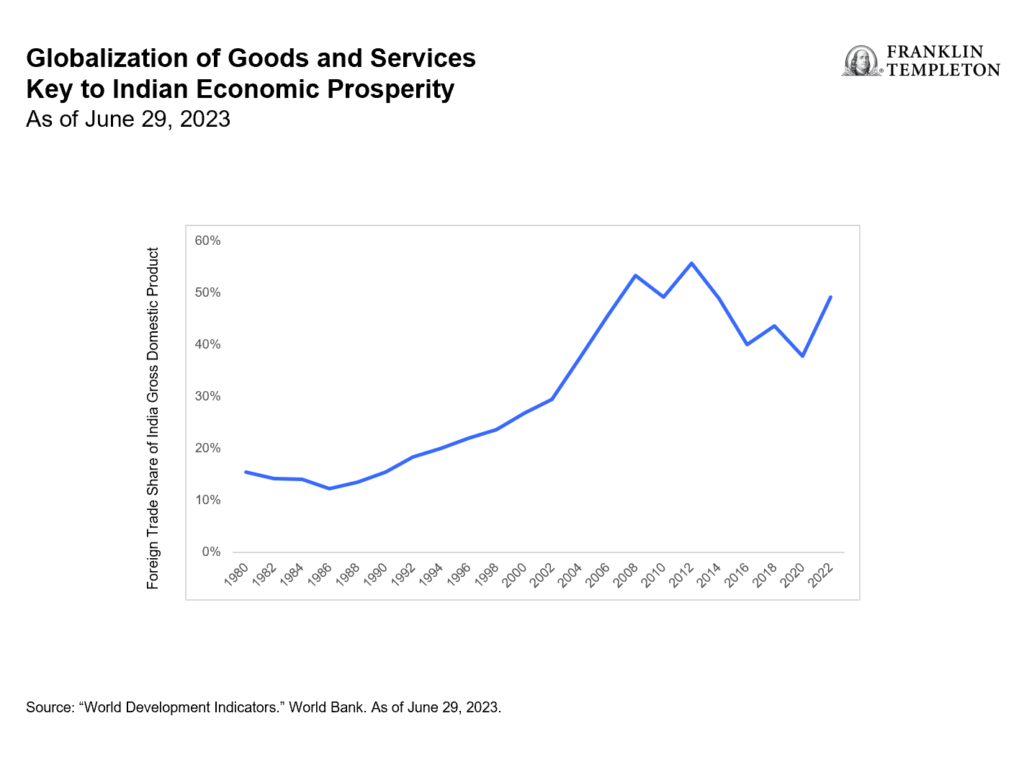
In the near term, India could lend support to the gold market. Indian gold demand has been very weak this year due mainly to the higher gold price. This suggests there is pent-up demand. A good monsoon season in India leads to a bountiful fall harvest that typically spurs demand ahead of the Diwali Festival in October.
Our June update highlighted a new bull trend in the gold price. The base of that trend is currently around $1,290 per ounce. If this price level holds through September, it would be a further sign of resilience in the gold market. A lower gold price, while disappointing, would indicate a new trendline with a lower trajectory. In the longer term, we regard the recent Fed machinations as just a bump in the road of a new bull market for gold.

The table below looks at the previous six bull markets since the U.S. terminated the direct link between the U.S. dollar and gold in 1971. The table shows the bull market of the 1970s as two phases, separated by a mid-cycle correction in 1975. The bull market of the 2000s is also shown as two phases, separated by the 2008 financial crash. The bull markets are further classified as either secular (long-term) or cyclical (bull phases within an overall bear market).

Click to enlarge

Performance is clearly much higher in secular markets. Across these secular markets, the performance of gold and the Barron’s Gold Mining Index4 (BGMI) are similar except for the 2001 to 2008 market when stocks substantially outperformed gold. We believe the reason stocks performed so well through 2008 is that this was a period of profit margin expansion when cost inflation was subdued for gold miners. In contrast, the ‘70s was a period of double-digit inflation across the entire economy, while 2008 to 2011 was a period of double-digit inflation that was confined to the mining industry. As a results of these periods of cost inflation, margins failed to keep pace with the gold price and stocks failed to outperform gold.

We believe the current market is similar to the 2001 to 2008 period. Mining costs have subsided and there are relatively no significant inflationary pressures. Other mining sectors — coal, tar sands, copper, iron ore — are depressed. We believe higher gold prices will encourage increased mining activity, but the gold sector alone cannot generate cost pressures without increasing activity in other mining sectors. In fact, we would use copper as a barometer of inflationary pressures in the mining business. With copper currently at $2.09 per pound, we would not anticipate inflationary pressures until copper trades above $3.00.

1NYSE Arca Gold Miners Index (GDMNTR) is a modified market capitalization-weighted index comprised of publicly traded companies involved primarily in the mining for gold. 2MVIS Global Junior Gold Miners Index (MVGDXJTR) is a rules-based, modified market capitalization-weighted, float-adjusted index comprised of a global universe of publicly traded small- and medium-capitalization companies that generate at least 50% of their revenues from gold and/or silver mining, hold real property that has the potential to produce at least 50% of the company’s revenue from gold or silver mining when developed, or primarily invest in gold or silver. 3Gluskin Sheff + Associates Inc., a Canadian independent wealth management firm, manages investment portfolios for high net worth investors, including entrepreneurs, professionals, family trusts, private charitable foundations, and estates. 4Barron’s Gold Mining Index (BGMI) is a weekly data series that spans seven decades from 1939 and is the sole survivor of the Barron’s Stock Averages which was published for 50 years (1939 to 1988) for over 20 industrial sectors.

Please note that the information herein represents the opinion of the author and these opinions may change at any time and from time to time.

by Joe Foster, Portfolio Manager and Strategist

With more than 30 years of gold industry experience, Foster began his gold career as a boots on the ground geologist, evaluating mining exploration and development projects. Foster is Portfolio Manager and Strategist for the Gold and Precious Metals strategy.

1In the U.S., the federal funds rate is “the interest rate” at which depository institutions actively trade balances held at the Federal Reserve, called federal funds, with each other, usually overnight, on an uncollateralized basis. Institutions with surplus balances in their accounts lend those balances to institutions in need of larger balances. 2The correlation coefficient is a measure that determines the degree to which two variables’ movements are associated and will vary from -1.0 to 1.0. -1.0 indicates perfect negative correlation, and 1.0 indicates perfect positive correlation. 3U.S. Dollar Index (DXY) indicates the general international value of the U.S. dollar. The DXY does this by averaging the exchange rates between the U.S. dollar and six major world currencies: Euro, Japanese yen, Pound sterling, Canadian dollar, Swedish kroner, and Swiss franc. 4The ISM Manufacturing Index is an index based on surveys of more than 300 manufacturing firms by the Institute of Supply Management. The ISM Manufacturing Index monitors employment, production inventories, new orders and supplier deliveries. 5A survey of consumer confidence conducted by the University of Michigan. The Michigan Consumer Sentiment Index (MCSI) uses telephone surveys to gather information on consumer expectations regarding the overall economy. 6The U.S. consumer confidence index (CCI) is an indicator designed to measure consumer confidence, which is defined as the degree of optimism on the state of the economy that consumers are expressing through their activities of savings and spending. 7NYSE Arca Gold Miners Index (GDMNTR) is a modified market capitalization-weighted index comprised of publicly traded companies involved primarily in the mining for gold. 8MVIS Global Junior Gold Miners Index (MVGDXJTR) is a rules-based, modified market capitalization-weighted, float-adjusted index comprised of a global universe of publicly traded small-and medium-capitalization companies that generate at least 50% of their revenues from gold and/or silver mining, hold real property that has the potential to produce at least 50% of the company’s revenue from gold or silver mining when developed, or primarily invest in gold or silver.

Please note that the information herein represents the opinion of the author and these opinions may change at any time and from time to time.

Important Information For Foreign Investors

This document does not constitute an offering or invitation to invest or acquire financial instruments. The use of this material is for general information purposes.

Please note that Van Eck Securities Corporation offers actively managed and passively managed investment products that invest in the asset class(es) included in this material. Gold investments can be significantly affected by international economic, monetary and political developments. Gold equities may decline in value due to developments specific to the gold industry, and are subject to interest rate risk and market risk. Investments in foreign securities involve risks related to adverse political and economic developments unique to a country or a region, currency fluctuations or controls, and the possibility of arbitrary action by foreign governments, including the takeover of property without adequate compensation or imposition of prohibitive taxation.

Please note that Joe Foster is the Portfolio Manager of an actively managed gold strategy.

Any indices listed are unmanaged indices and include the reinvestment of all dividends, but do not reflect the payment of transaction costs, advisory fees or expenses that are associated with an investment in the Fund. An index’s performance is not illustrative of the Fund’s performance. Indices are not securities in which investments can be made.

1U.S. Dollar Index (DXY) indicates the general international value of the U.S. dollar. The DXY does this by averaging the exchange rates between the U.S. dollar and six major world currencies: Euro, Japanese yen, Pound sterling, Canadian dollar, Swedish kroner, and Swiss franc. 2NYSE Arca Gold Miners Index (GDMNTR) is a modified market capitalization-weighted index comprised of publicly traded companies involved primarily in the mining for gold. 3MVIS Global Junior Gold Miners Index (MVGDXJTR) is a rules-based, modified market capitalization-weighted, float-adjusted index comprised of a global universe of publicly traded small- and medium-capitalization companies that generate at least 50% of their revenues from gold and/or silver mining, hold real property that has the potential to produce at least 50% of the company’s revenue from gold or silver mining when developed, or primarily invest in gold or silver. 4Fannie Mae (Federal National Mortgage Association); Freddie Mac (Federal Home Loan Mortgage Corporation)

Please note that the information herein represents the opinion of the author and these opinions may change at any time and from time to time. Not intended to be a forecast of future events, a guarantee of future results or investment advice. Historical performance is not indicative of future results; current data may differ from data quoted. Current market conditions may not continue. Non-VanEck proprietary information contained herein has been obtained from sources believed to be reliable, but not guaranteed. No part of this material may be reproduced in any form, or referred to in any other publication, without express written permission of VanEck. ©2016 VanEck.

Fortsätt läsa
Annons
Klicka för att kommentera

Skriv en kommentar

Din e-postadress kommer inte publiceras. Obligatoriska fält är märkta *

Nyheter

Vilken är den bästa fond som följer Nasdaq-100?

Publicerad

den

Nasdaq 100-indexet följer de 100 största aktierna noterade på Nasdaq-börsen. De utvalda företagen kommer huvudsakligen från sektorer som hårdvara och mjukvara, telekommunikation, detaljhandel och bioteknik – inklusive alla stora amerikanska teknikföretag. Däremot ingår inte företag från energi-, finans- och fastighetssektorerna i Nasdaq-100. Vilken är den bästa fond som följer Nasdaq-100?

Nasdaq 100-indexet följer de 100 största aktierna noterade på Nasdaq-börsen. De utvalda företagen kommer huvudsakligen från sektorer som hårdvara och mjukvara, telekommunikation, detaljhandel och bioteknik – inklusive alla stora amerikanska teknikföretag. Däremot ingår inte företag från energi-, finans- och fastighetssektorerna i Nasdaq-100. Vilken är den bästa fond som följer Nasdaq-100?

I USA har den populära QQQ ETF, som spårar Nasdaq 100, varit tillgänglig sedan 1999. Den förvaltas av Invesco. Den europeiska motsvarigheten till denna ETF använder tickersymbolen eQQQ. Till skillnad från den amerikanska marknaden finns det dock flera ETF-leverantörer i Europa som spårar Nasdaq 100 – så det är värt att jämföra.

ETF-investerare kan dra nytta av värdeökningar och utdelningar från Nasdaq 100-beståndsdelarna. För närvarande spåras Nasdaq 100-indexet av tretton ETFer.

Förvaltningsarvode fond som följer Nasdaq-100

Nedan har vi listat förvaltningsarvoden för fond som följer Nasdaq-100. Samtliga dessa ETFer har en konkurrenskraftig prissättning, allt från AXA IM Nasdaq 100 UCITS ETF USD Acc, som debiterar sina andelsägare 0,14 procent per år till iShares Nasdaq 100 UCITS ETF (Acc) som tar ut 0,33 procent i arvode. I jämförelse kostar de flesta aktivt förvaltade fonder mycket mer avgifter per år.

NamnValutaISINKortnamnFörvaltningsavgift
AXA IM Nasdaq 100 UCITS ETF USD AccUSDIE000QDFFK00ANAU0.14%
Invesco Nasdaq-100 Swap UCITS ETF AccUSDIE00BNRQM384EQQX0.20%
Invesco Nasdaq-100 Swap UCITS ETF DistUSDIE000RUF4QN8EQQD0.20% p.a.
Xtrackers Nasdaq 100 UCITS ETF 1CUSDIE00BMFKG444XNAS0.20%
Amundi Nasdaq-100 II UCITS ETF AccEURLU1829221024LYMS0.22%
Amundi Nasdaq-100 II UCITS ETF DistUSDLU2197908721NADQ0.22%
Amundi Nasdaq 100 UCITS ETF EUR (C)EURLU16810382436AQQ0.23%
Amundi Nasdaq 100 UCITS ETF USDUSDLU168103832610A40.23%
Deka Nasdaq-100® UCITS ETFEURDE000ETFL623D6RH0.25%
Invesco EQQQ Nasdaq-100 UCITS ETFUSDIE0032077012EQQQ0.30%
Invesco EQQQ Nasdaq-100 UCITS ETF AccUSDIE00BFZXGZ54EQQB0.30%
iShares Nasdaq 100 UCITS ETF (DE)USDDE000A0F5UF5EXXT0.31%
iShares Nasdaq 100 UCITS ETF (Acc)USDIE00B53SZB19SXRV0.33%

Som alltid vill vi påminna att om det finns flera olika börshandlade fonder som täcker samma index eller segment är det förvaltningskostnaden som avgör. Antar vi att dessa Nasdaqfonder ger samma avkastning kommer den som har lägst avgift att utvecklas bäst, allt annat lika. Grundregeln är alltså, betala aldrig för mycket då detta kommer att äta upp din avkastning.

Nasdaq 100 ETFer i jämförelse

Förutom avkastning finns det ytterligare viktiga faktorer att tänka på när du väljer en Nasdaq 100 ETF. För att ge ett bra beslutsunderlag hittar du en lista över alla Nasdaq 100 ETFer med detaljer om vinstanvändning, fondens hemvist och replikeringsmetod.

NamnUtdelningspolicyHemvistReplikeringsmetod
iShares Nasdaq 100 UCITS ETF (Acc)AckumulerandeIrlandFysisk replikering
Invesco EQQQ Nasdaq-100 UCITS ETFUtdelandeIrlandFysisk replikering
iShares Nasdaq 100 UCITS ETF (DE)UtdelandeTysklandFysisk replikering
Amundi Nasdaq-100 II UCITS ETF AccAckumulerandeLuxemburgOfinansierad swap
Invesco EQQQ Nasdaq-100 UCITS ETF AccAckumulerandeIrlandFysisk replikering
Amundi Nasdaq 100 UCITS ETF EUR (C)AckumulerandeLuxemburgOfinansierad swap
Amundi Nasdaq-100 II UCITS ETF DistUtdelandeLuxemburgOfinansierad swap
AXA IM Nasdaq 100 UCITS ETF USD AccAckumulerandeIrlandFysisk replikering
Xtrackers Nasdaq 100 UCITS ETF 1CAckumulerandeIrlandFysisk replikering
Invesco Nasdaq-100 Swap UCITS ETF AccAckumulerandeIrlandOfinansierad swap
Amundi Nasdaq 100 UCITS ETF USDAckumulerandeLuxemburgOfinansierad swap
Invesco Nasdaq-100 Swap UCITS ETF DistUtdelandeIrlandOfinansierad swap
Deka Nasdaq-100® UCITS ETFUtdelandeTysklandFysisk replikering

Handla fond som följer Nasdaq-100

Samtliga dessa ETFer är europeiska börshandlade fonder. Dessa fond handlas på flera olika börser, till exempel Deutsche Boerse Xetra och London Stock Exchange.

Det betyder att det går att handla andelar i denna ETF genom de flesta svenska banker och Internetmäklare, till exempel DEGIRONordnet, Aktieinvest och Avanza.

Fortsätt läsa

Nyheter

Inevitable in India: Crowds, cricket and capital gains tax

Publicerad

den

capital gains tax India’s vibrant economy and structural growth opportunities continue to be the envy of many emerging markets. But somewhat unique to this market are tax implications that investors should be aware of. Our Franklin Templeton Global ETF team examines these structural issues in Asia’s third-largest economy.

India’s vibrant economy and structural growth opportunities continue to be the envy of many emerging markets. But somewhat unique to this market are tax implications that investors should be aware of. Our Franklin Templeton Global ETF team examines these structural issues in Asia’s third-largest economy.

In merely a decade, India has taken a quantum leap from the world’s 11th largest economy to become its fifth largest. By many accounts, it is expected to remain one of the world’s fastest-growing major economies over the coming years. And even after a banner 2023 during which the country’s benchmark indexes surged and Indian Prime Minister Narendra Modi celebrated high-profile successes—from historic technological and space exploration achievements to rising global diplomatic clout—this election year has already marked more progress in supporting Modi’s pro-growth, pro-jobs efforts.

The world’s most populous nation has advanced ties with Western countries over free trade. In addition to agreements with Australia and the United Arab Emirates, it has worked to better integrate the “Global South’s” development needs and ambitions with that of the G20. Modi has touted innovative partnerships for a new multilateral rail and sea corridor to connect India with the Middle East and the European Union (EU)—seen as a counterweight to China’s vast Belt-and-Road infrastructure corridor.

India reached its latest notable trade pact, nearly 16 years in the making, in March with the European Free Trade Association—Iceland, Liechtenstein, Norway and Switzerland. The agreement lifts Indian tariffs to secure US$100 billion in foreign direct investment commitments from the non-EU markets to India across multiple sectors.

With India still an enviable investment powerhouse, it seems important to clarify a few aspects of this dynamic equity market.

How exchange-traded funds (ETFs) treat India capital gains tax (CGT)

Foreign investors should be aware that CGT is an integral part of investing in Indian equities that cannot be circumvented. Investors in India funds are subject to CGT implications regardless of fund provider, and CGT is based and calculated on a fund as a whole, not an individual investor’s position.

The details: Foreign investors owning local Indian stocks are subject to taxation on capital gains at a short-term rate of 15% for positions held for less than one year and at a long-term rate of 10% for positions held over one year.

To accrue or not to accrue: Consistent with market practice for US-listed India ETF providers, Franklin Templeton accrues unrealized CGT in its daily net asset value (NAV). This can lead to differences in performance relative to the benchmark, which does not include CGT. As a result, rising markets will typically lead to fund underperformance against a benchmark, while weaker market environments will typically generate outperformance (provided the fund is in an unrealized capital gain position where the current market value of fund holdings is above their historical book cost). See chart below.

For UCITS-listed India funds, there is a divergence in methods utilized by fund providers in accruing and reporting CGT. Some do not accrue unrealized CGT in the NAV, but will charge CGT to investors directly at redemption, which we believe leaves investors with a level of opaqueness and uncertainty over their ultimate proceeds. This method also creates an elevated NAV compared to what investors will actually experience. While Franklin Templeton’s approach to CGT may at times lead to a higher tracking difference,1 we believe investors benefit from increased transparency and a more reflective experience.

The magnitude and impact of CGT for a specific fund is heavily dependent on several variables, such as the timing of purchases and sales, performance of the holdings and their volatility, and the size of flows in and out of the fund relative to its assets under management (AUM).

Understanding the impact: The CGT impact to fund performance is driven by the path of returns, timing of individual lots and price points. Very broadly speaking, in rising markets, an NAV-accruing fund will likely underperform its benchmark and vice versa.

Consideration of comparability: Because different providers handle CGT differently, the comparability of fund performance metrics may be affected. As investors, it’s prudent to consider how these nuances may influence investment decisions within the broader context of your financial strategy.

The bigger picture: While CGT considerations are important, they should be viewed within the broader spectrum of investment objectives and risk tolerance. Taking a long-term perspective and being mindful of other important characteristics of the investment vehicle of choice may aid in the decision-making process.

In summary, India remains an attractive investment destination with compelling growth prospects for its equity markets. Investors seeking India allocation through an ETF should be aware of the current tax regime and what varying methods of accounting methodologies really mean for fund valuation.

Fortsätt läsa

Nyheter

XB33 ETF köper företagsobligationer i euro som förfaller 2033

Publicerad

den

Xtrackers II Target Maturity Sept 2033 EUR Corporate Bond UCITS ETF 1D (XB33 ETF) med ISIN LU2673523564, försöker följa Bloomberg MSCI Euro Corporate September 2033 SRI-index. Bloomberg MSCI Euro Corporate September 2033 SRI-index följer företagsobligationer denominerade i EUR. Indexet speglar inte ett konstant löptidsintervall (som är fallet med de flesta andra obligationsindex). Istället ingår endast obligationer som förfaller mellan oktober 2032 och september 2033 i indexet (ETF kommer att stängas i efterhand). Indexet består av ESG (environmental, social and governance) screenade företagsobligationer. Betyg: Investment Grade.

Xtrackers II Target Maturity Sept 2033 EUR Corporate Bond UCITS ETF 1D (XB33 ETF) med ISIN LU2673523564, försöker följa Bloomberg MSCI Euro Corporate September 2033 SRI-index. Bloomberg MSCI Euro Corporate September 2033 SRI-index följer företagsobligationer denominerade i EUR. Indexet speglar inte ett konstant löptidsintervall (som är fallet med de flesta andra obligationsindex). Istället ingår endast obligationer som förfaller mellan oktober 2032 och september 2033 i indexet (ETF kommer att stängas i efterhand). Indexet består av ESG (environmental, social and governance) screenade företagsobligationer. Betyg: Investment Grade.

Den börshandlade fondens TER (total cost ratio) uppgår till 0,12 procent p.a. Xtrackers II Target Maturity Sept 2033 EUR Corporate Bond UCITS ETF 1D är den enda ETF som följer Bloomberg MSCI Euro Corporate September 2033 SRI-index. ETFen replikerar det underliggande indexets prestanda genom samplingsteknik (köper ett urval av de mest relevanta indexbeståndsdelarna). Ränteintäkterna (kupongerna) i ETFen delas ut till investerarna (Minst årligen).

Denna ETF lanserades den 8 november 2023 och har sin hemvist i Luxemburg.

Bloomberg MSCI Euro Corporate SRI PAB Index syftar till att spegla resultatet på följande marknad:

  • EUR-denominerade företagsobligationer
  • Endast obligationer med investeringsklass
  • Obligationer med en löptid på minst 1 år
  • Minsta utestående belopp på 300 miljoner euro per obligation
  • Endast obligationer utgivna av företag med en MSCI ESG-rating på BBB eller högre och en MSCI ESG Impact Monitor över 1 ingår

Indexet övervakar absoluta växthusgasutsläpp (“GHG”) genom att sätta en initial 50 % avkolning av absoluta växthusgasutsläpp i förhållande till moderuniversumet följt av en årlig 7 % avkolningsbana för absoluta växthusgasutsläpp.

Obligationer utgivna av företag som är involverade i alkohol, tobak, hasardspel, vuxenunderhållning, genetiskt modifierade organismer (GMO), kärnkraft, civila skjutvapen, militära vapen (inklusive minor, klusterbomber, kemiska vapen) är undantagna.

Handla XB33 ETF

Xtrackers II Target Maturity Sept 2033 EUR Corporate Bond UCITS ETF 1D (XB33 ETF) är en europeisk börshandlad fond. Denna fond handlas på Deutsche Boerse Xetra.

Det betyder att det går att handla andelar i denna ETF genom de flesta svenska banker och Internetmäklare, till exempel DEGIRONordnet, Aktieinvest och Avanza.

Börsnoteringar

BörsValutaKortnamn
XETRAEURXB33

Största innehav

ISINNamnVikt %Land
IE00BZ3FDF20DEUTSCHE GLOBAL LIQUIDITY SERI0.54%Irland
CH1214797172BBG01BFYVYX8 CREDIT SUISSE GROUP AG 3/290.18%Schweiz
XS0525602339RABOBANK 07/250.14%Holland
FR0000471930FRANCE TELECOM 01/330.13%Frankrike
FR0013324357SANOFI SA 1.375% 2030-03-210.12%Frankrike
XS1001749289MICROSOFT CORP 12/280.12%USA
XS1372839214VODAFONE GROUP PLC 08/26 EUR515200.12%Storbritannien
XS2461234622BBG0162QT3D3 JPMORGAN CHASE AND CO 3/300.11%USA
XS2235996217NOVARTIS FINANCE SA 9/280.11%Spanien
XS2705604234BBG01JPP1244 BANCO SANTANDER SA 10/310.11%Spanien
FR0013398070BNP PARIBAS 01/26 AW7468680.11%Frankrike
XS2180007549AT&T INC 5/280.11%Frankrike
XS2149207354GOLDMAN SACHS GROUP INC 3/250.10%USA
XS1603892149MORGAN STANLEY DEAN WITTER 04/27 AN3187610.10%USA
CH0537261858CREDIT SUISSE GROUP AG SR UNSECURED REGS 04/26 VAR 4/250.10%Schweiz

Innehav kan komma att förändras

Fortsätt läsa

Populära