
Nyheter
Mixed Signals in Emerging Markets
VanEck Unconstrained Emerging Markets Bond – Mixed Signals in Emerging Markets
The market environment remains unsettled. The quality of the macro flow in major economies is still largely uneven (despite a larger number of positive macro surprises in both G10 and EM) and many central banks find themselves in a policy quagmire as additional monetary easing results in stronger currencies and higher interest rates. Markets continue to price in a dovish scenario for the Fed that envisages only two full policy rate hikes in the next three years. Neutral investor positioning (as measured, for example, by the American Association of Individual Investors) is up again. We interpret this as a by-product of tensions between serious macro/policy headwinds and tailwinds. The “tailwinds” cluster includes tentative signs that EM growth might be bottoming out, reasonably strong external accounts in many EMs and the stabilization (at least for now) of China’s international reserves. On the “headwinds” side of the equation we find multiple unresolved issues in Europe, major imbalances in China (possibly made worse by the recent policy moves), a Fed struggling with forward guidance, a massive widening of the EM fiscal gap and deteriorating corporate profitability. It is also worth noting that China’s activity indicators and the external trade numbers softened in the past month. We are also alarmed by the extent of speculation with commodity futures in China.
We think that many tailwinds exist…but will ultimately face headwinds. First, Chinese authorities have managed to slow down capital outflows through official channels. The valuation-adjusted decline in international reserves is now smaller than in November- December 2015. Authorities are also implementing additional measures to prop up growth – mainly through additional credit supply – albeit as we noted the latest activity numbers came below expectations. Possible fiscal stimulus might prop-up GDP growth as well. These factors should reduce the immediate depreciation pressure on CNY and authorities should be able to maintain the existing exchange rate regime for a little longer, alleviating concerns about the impact of CNY devaluation on other emerging currencies (especially in Asia). There are tentative signs (macro surprises, EM PMIs a touch stronger than in December) that the growth outlook in EM stopped deteriorating and additional policy support (if EM FX weakness is contained) might prove crucial for further progress. Limited EM FX weakness is also generally beneficial for the inflation outlook and lower inflation can further boost real interest rates in EM – which already look attractive relative to the past lows and relative to U.S. treasuries. An important aspect of China’s current policy mix is its positive impact (however temporary) on the housing market and, as such, on global commodity prices which should provide additional support to EM FX and external balances. However, the extent of China’s commodity speculation is of course an important question mark.
We also continue to believe that the headwinds abound and are persistent…and are winning for now. Our key concern is that China’s near-term growth/FX relief might come at a price of worsening imbalances which would make any future resolution more problematic. Specifically, the leverage context remains highly worrisome as authorities intend to accelerate money supply (M2 growth). The same applies to a very high bank assets/nominal GDP ratio especially when compared to China’s relatively low per capita GDP. The success of China’s credit boost is questionable given that it now takes four extra units of credit (TSF) to produce one extra unit of nominal GDP. Despite the recent small improvements, both China’s growth slowdown and the decline in international reserves are of historic proportions and the reserve adequacy now looks stretched on several metrics. So, while we acknowledge the recent positive signals coming from China, our longer-term view on China’s economic, policy and political challenges remains unchanged. Another set of concerns relates to the recent fiscal deterioration in EM and rating downgrades it might entail. After several years of stability (2010-2014), the aggregate EM fiscal gap widened sharply in 2015 reaching 3.7% of GDP – the worst in the past 15 years – and consensus expects further deterioration to 4% of GDP in 2016 and only small improvement to 3.5% of GDP in 2017. We doubt that rating agencies would respond kindly to the deterioration and expect further rating/outlook downgrades. Our third set of concerns centers on unresolved European issues. We are now on the final stretch to the Brexit vote in June, while the Grexit problem is resurfacing again and will keep on reappearing unless there are more radical steps taken to reduce the debt burden. The immigration/ refugee issue looks thoroughly mishandled and we should expect a further rise of political extremism. The situation in the European banking sector is murky at best and bank CDS failed to narrow further after the initial declines after the ECB meetings in March and April. There is also growing evidence that negative interest rates are punishing banks. Fourth, corporate profitability is deteriorating and capex spending remains high relative to cash flow from operations. Finally, markets might be pricing in too much of the Fed’s dovishness (only 18bps of hikes are seen in the next 12 months) in a situation when many inflation indicators are picking up. The U.S. growth outlook is likely to improve in Q2 and it appears there is virtually no visible deterioration in the labor market conditions.
The portfolio implications of these developments can be summarized as follows: (1) be nimble and liquid (the unconstrained approach is more important than ever); (2) be aware of the headwinds (we view them as resurgent) and have a reaction function (ours is when China’s property market stalls again and/or the Fed hikes); (3) respect tailwinds in downturns – big and long rallies often happen when things are bad. Specifically, we maintain our defensive positions (around 30% of the portfolio) in hard currency bonds with spread/beta (Argentina and Brazil) and/or with defensive characteristics (Israel and South Korea). We also reduced exposure to local currency denominated bonds (to about 10% of the portfolio). We focus on countries with high real interest rates, with central banks that are not afraid to tighten if necessary and whose currencies were allowed to depreciate during the past risk-off episodes (Argentina, Indonesia and Brazil). Finally, we have exposure to selective EM corporates (about 15% of our portfolio) – we focus on liquid companies that are low beta to the economy and that can benefit from FX weakness through local-currency costs.
Exposure Types and Significant Changes
The changes to our top positions are summarized below. Our largest positions are currently: South Korea, Brazil, Argentina, Mexico, and South Africa.
We added hard currency sovereign exposure in South Korea and Israel. Both countries are high-rated net creditors with solid fiscal and external positions and we regard their hard currency bonds as defensive diversifiers.
We also added hard currency sovereign exposure in Chile, Turkey and the Philippines. The external balances in Chile and Turkey are improving and the external position of the Philippines remains robust. It was also encouraging that the new governor of Turkey’s central bank has not surprised markets on the dovish side during his first monetary policy decision.
We reduced local currency exposure in Peru, Indonesia and Malaysia. In Malaysia, authorities’ failure to resolve the 1 Malaysia Development Berhad (1MDB) saga once and for all – with the latest episode genuinely surprising markets – is weighing on local assets. In Peru and Indonesia, local currencies no longer look cheap relative to the underlying commodity prices and in Indonesia there is an additional supply risk.
We also reduced local currency exposure in Mexico and Russia on concerns that they have over-reacted to commodity price stability.
Fund Performance
- The Fund (EMBAX) gained 1.28% in April, compared to a 2.17% gain for a 50% local-50% hard-currency index.
- The Fund’s biggest winners were Brazil, Argentina, and Indonesia. The Fund’s biggest losers were Russia, Mexico and Peru.
- Turning to the market’s performance, the GBI-EM’s biggest winners were Brazil, Peru and Colombia. The biggest losers were Poland, Romania and China.
The EMBI’s biggest winners were Belize, Venezula and Angola, while its biggest losers were Malaysia, Ivory Coast and China.

†Monthly returns are not annualized.
Please note that the information herein represents the opinion of the portfolio manager and these opinions may change at any time and from time to time.
Diversification does not assure a profit or prevent against a loss.
Expenses: Class A: Gross 1.44%; Net 1.25%. Expenses are capped contractually until 05/01/17 at 1.25% for Class A. Caps exclude certain expenses, such as interest. Please note that, generally, unconstrained bond funds may have higher fees than core bond funds due to the specialized nature of their strategies.
The tables above present past performance which is no guarantee of future results and which may be lower or higher than current performance. Returns reflect applicable fee waivers and/or expense reimbursements. Had the Fund incurred all expenses and fees, investment returns would have been reduced. Investment returns and Fund share values will fluctuate so that investors’ shares, when redeemed, may be worth more or less than their original cost. Fund returns assume that dividends and capital gains distributions have been reinvested in the Fund at Net Asset Value (NAV). Index returns assume that dividends of the index constituents have been reinvested. Investing involves risk, including loss of principal; please see disclaimers on next page. Please call 800.826.2333 or visit vaneck.com for performance current to the most recent month ended.
By Eric Fine, Portfolio Manager
11 Malaysia Development Berhad (1MDB) is a strategic development company, wholly owned by the Government of Malaysia. The G10 currencies are 10 of the most heavily traded currencies in the world.
Duration measures a bond’s sensitivity to interest rate changes that reflects the change in a bond’s price given a change in yield. This duration measure is appropriate for bonds with embedded options. Quantitative Easing by a central bank increases the money supply engaging in open market operations in an effort to promote increased lending and liquidity. Monetary Easing is an economic tool employed by a central bank to reduce interest rates and increase money supply in an effort to stimulate economic activity. Correlation is a statistical measure of how two variables move in relation to one other. Liquidity Illusion refers to the effect that an independent variable might have in the liquidity of a security as such variable fluctuates overtime. A Holdouts Issue in the fixed income asset class occurs when a bond issuing country or entity is in default or at the brink of default, and launches an exchange offer in an attempt to restructure its debt held by existing bond holding investors.
Emerging Markets Hard Currency Bonds refers to bonds denominated in currencies that are generally widely accepted around the world (such as the U.S.-Dollar, Euro or Yen). Emerging Markets Local Currency Bonds are bonds denominated in the local currency of the issuer. Emerging Markets Sovereign Bonds are bonds issued by national governments of emerging countries in order to finance a country’s growth. Emerging Markets Quasi- Sovereign Bonds are bonds issued by corporations domiciled in emerging countries that are either 100% government owned or whose debts are 100% government guaranteed. Emerging Markets Corporate Bonds are bonds issued by non-government owned corporations that are domiciled in emerging countries.
All indices are unmanaged and include the reinvestment of all dividends, but do not reflect the payment of transaction costs, advisory fees or expenses that are associated with an investment in the Fund. An index’s performance is not illustrative of the Fund’s performance. Indices are not se¬curities in which investments can be made. The 50/50 benchmark (the “Index”) is a blended index consisting of 50% J.P. Morgan Emerging Markets Bond Index (EMBI) Global Diversified and 50% J.P. Morgan Government Bond Index-Emerging Markets Global Diversified (GBI-EM). The J.P. Morgan Government Bond Index-Emerging Markets Global Diversified (GBI-EM) tracks local currency bonds issued by Emerging Markets governments. The index spans over 15 countries. J.P. Morgan Emerging Markets Bond Index (EMBI) Global Diversified tracks returns for actively traded external debt in¬struments in emerging markets, and is also J.P. Morgan’s most liquid U.S-dollar emerging markets debt benchmark. The J.P. Morgan Emerging Country Currency Index (EMCI) is a tradable benchmark for emerging markets currencies versus the U.S. Dollar (USD). The Index compromises 10 currencies: BRL, CLP, CNH, HUF, INR, MXN, RUB, SGD, TRY and ZAR. The Consumer Confidence Index (CCI) is an indicator designed to measure consumer confidence, which is defined as the degree of optimism on the state of the economy that consumers are expressing through their activities of savings and spending.
Information has been obtained from sources believed to be reliable but J.P. Morgan does not warrant its completeness or accuracy. The Index is used with permission. The index may not be copied, used or distributed without J.P. Morgan’s written approval. Copyright 2014, J.P. Morgan Chase & Co. All rights reserved.
Please note that the information herein represents the opinion of the portfolio manager and these opinions may change at any time and from time to time and portfolio managers of other investment strategies may take an opposite opinion than those stated herein. Not intended to be a forecast of future events, a guarantee of future results or investment advice. Current market conditions may not continue. Non-VanEck proprietary information con¬tained herein has been obtained from sources believed to be reliable, but not guaranteed. No part of this material may be reproduced in any form, or referred to in any other publication, without express written permission of Van Eck Securities Corporation ©2016 VanEck.
Investing involves risk, including loss of principal. You can lose money by investing in the Fund. Any investment in the Fund should be part of an over¬all investment program, not a complete program. The Fund is subject to risks associated with its investments in emerging markets securities. Investing in foreign denominated and/or domiciled securities may involve heightened risk due to currency fluctuations, and economic and political risks, which may be enhanced in emerging markets. As the Fund may invest in securities denominated in foreign currencies and some of the income received by the Fund will be in foreign currencies, changes in currency exchange rates may negatively impact the Fund’s return. Derivatives may involve certain costs and risks such as liquidity, interest rate, market, credit, management and the risk that a position could not be closed when most advantageous. The Fund may also be subject to credit risk, interest rate risk, sovereign debt risk, tax risk, non-diversification risk and risks associated with non-invest¬ment grade securities. Please see the prospectus and summary prospectus for information on these and other risk considerations.
Investors should consider the Fund’s investment objective, risks, and charges and expenses carefully before investing. Bond and bond funds will decrease in value as interest rates rise. The prospectus and summary prospectus contain this as well as other information. Please read them carefully before investing. Please call 800.826.2333 or visit vaneck.com for performance information current to the most recent month end and for a free prospectus and summary prospectus.


• Regulatory Crackdowns Fire Up in April
• Macro Uncertainty, Geopolitical Headwinds, and Bitcoin’s Fourth Halving
• The Arrival of Ethereum’s Most Anticipated Application
Macro Uncertainty, Geopolitical Headwinds, and Bitcoin’s Fourth Halving
April brought a challenging landscape for Bitcoin. Geopolitical tensions flared in the Middle East when Israel targeted the Iranian Consulate in Syria on the 1st of April. In an unprecedented response, Iran retaliated directly with a drone strike against Israel, intensifying hostilities. The event contributed to a decline in the stock market and a temporary pullback in Bitcoin’s price. As mentioned two weeks ago, although Bitcoin historically served as a safe haven during crises like the Russian Invasion of Ukraine, its response to Iran-Israeli escalation may have been adverse.
However, a closer look at the market reveals a more nuanced picture. The impact on Bitcoin was primarily felt in the futures market, where open interest peaked at $35 billion on the day of the Consumer Price Index (CPI) print, leading to significant liquidations when inflation came in hotter than expected for the fourth month running. Resilience in the labor market, coupled with strong domestic demand, is evidence that despite Fed efforts, the US is not yet in a position for rate cuts, which may pose further turbulence for risk-on assets. Encouragingly, long-term holders demonstrated resilience amidst escalating tensions. Unlike short-term fears reflected in futures markets, long-term holders increased their supply by 0.1% over the past week, for the first time since January, as the Israeli response seemingly coincided with a local bottom for long-term holder supply. This is a bullish signal, showcasing belief in the asset, irrespective of recent market activity. Nevertheless, we can see that BTC will continue to be stuck in the $60K – $70K range until we get more clarity on the macroeconomic and geopolitical front.
Figure 1: Bitcoin Short-Term Holder Supply vs. Long-Term Holder Supply

Source: Glassnode
Despite the macroeconomic headwinds, significant progress was made in the institutional adoption of Bitcoin. Despite a break in Blackrock’s Bitcoin ETF 71-day net inflow streak, the conclusion of the 90-day due diligence period for fund managers considering the spot ETFs revealed that over 100 institutions, such as BNY Mellon and Banco do Brazil, are exposed to Bitcoin. Morgan Stanley is also actively exploring allowing 15,000 brokers to provide this exposure to their clients. They also filed to broaden access to BTC ETFs by expanding it to 12 more funds, signifying the growing acceptance of Bitcoin by TradFi institutions. Finally, the launch of Bitcoin ETFs in Hong Kong marked a significant step towards adoption in Asia, potentially influencing other jurisdictions like South Korea, Japan, and Singapore to follow suit while expanding Bitcoin’s access to Hong Kong’s $1.15 trillion wealth management sector.
Beyond the market’s activity, April also marked a historic event for Bitcoin: the fourth halving, reducing Bitcoin’s annual inflation rate to below 1%, making it even scarcer than Gold. Historically, Bitcoin trades 50% down from its peak leading up to the halving. This year, Bitcoin defied historical trends, reaching a new all-time high prior to the halving, attributed to the surge in demand from the aforementioned US Bitcoin ETFs, coupled with ongoing technical advancements within the Bitcoin ecosystem, such as Ordinals, BRC-20s, and Runes, as touched upon in the last newsletter.
These advancements are transforming Bitcoin beyond its original vision as a purely decentralized payment network. The emergence of Ordinals and Runes has amplified on-chain activity, reflected in surging transaction fees. This is particularly beneficial for Bitcoin miners, who saw their block reward cut in half due to the halving. Higher transaction fees help compensate for this lost revenue, ensuring the continued security of the Bitcoin network. Notably, as shown in Figure 2, Bitcoin transaction fees made up 75% of Bitcoin miner revenue, soaring to $128 on the day of the halving. While the surge might have been driven by the desire to have a historical inscription, it does underscore the potential impact on miners’ revenue as Bitcoin’s on-chain ecosystem matures.
Figure 2: Bitcoin Miners Revenue
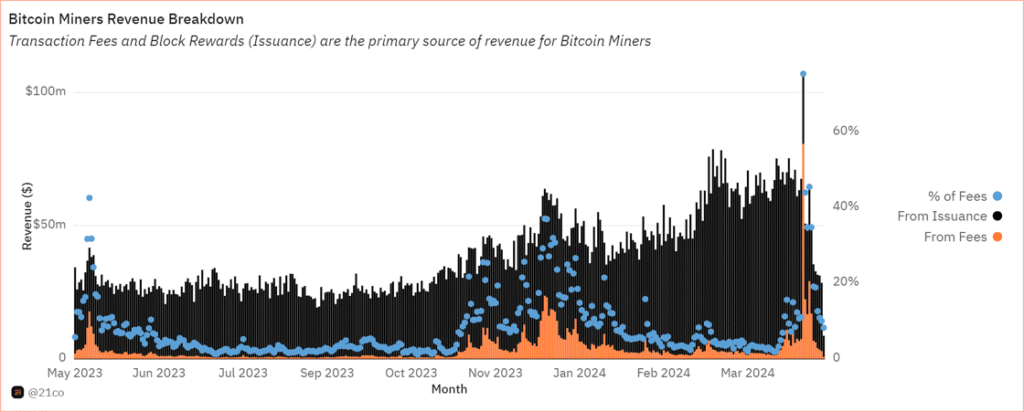
Source: 21.co on Dune
Launched in April, Runes Protocol offers a novel approach to creating fungible tokens on the Bitcoin network. It addresses inefficiencies associated with the BRC-20 standard, which have burdened the Bitcoin blockchain due to its inefficient data handling. Ultimately, Runes presents a key innovation that bolsters Bitcoin’s security budget by offering miners an alternative source of revenue, while reducing their dependence on block rewards. Runes has already rewarded miners with almost $150 million, impressively making up 80% of fees generated on the Bitcoin network on April 23, as shown below.
Figure 3: Share of Bitcoin Transaction Fees
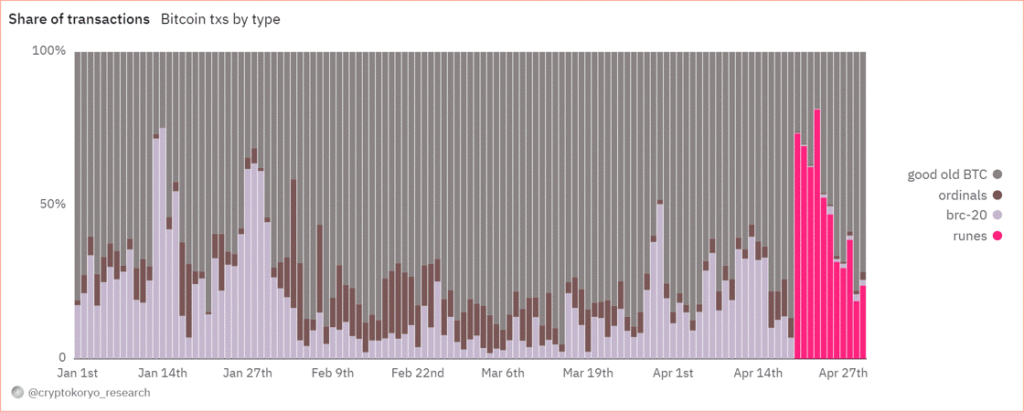
Source: CryptoKoryo on Dune
While Bitcoin’s daily transaction volume surpassed 1 million, rivaling Ethereum’s activity, the initial excitement surrounding Runes might recede before a more long-term, sustainable surge in the network’s DeFi activity. The initial phase often focuses on meme-like tokens attracting rapid but fleeting interest. However, the development of sophisticated DeFi protocols like exchanges and Automated Market Makers (AMMs) will enhance Bitcoin’s application layer, streamlining token trading similar to what ERC-20/ERC-721 standards did for Ethereum. This paves the way for a more robust and mature DeFi ecosystem on Bitcoin, which we will closely monitor in the months to come.
Regulatory Crackdowns Fire Up in April
April saw the continued regulation-by-enforcement trend, cracking down on non-custodial infrastructure and the Ethereum ecosystem. On April 10, the Securities and Exchange Commission (SEC) sent Wells Notices to Uniswap and Consensys for alleged violation of federal securities law. Uniswap announced its intention to resolve this through court. The details of the SEC’s Wells Notice remain unclear. However, it could have been triggered by Uniswap’s pending revenue-sharing initiative, which has had a domino effect on the ecosystem. In the short term, the crackdown could dissuade protocols from following suit, which would have incentivized their users to stake and delegate their tokens for a share of the revenue.
On April 25, Consensys filed a lawsuit against the SEC for “unlawful seizure of authority,” arguing that Ethereum is not a security nor that MetaMask is a securities broker. The recent crackdown could put a strain on the crypto infrastructure industry in the short term, as it could severely disrupt the ecosystem while encouraging companies to explore alternative jurisdictions aside from the U.S. market.
Earlier in February, the SEC adopted rules that widened its interpretation of a dealer to include “as part of a regular business” in addition to the initial definition, “any person engaged in the business of buying and selling securities . . . for such person’s own account through a broker or otherwise.” The newly adopted rules have now triggered an outcry in the crypto community, deeming the legislation too broad, as it includes average market participants in cryptoasset liquidity pools (liquidity providers), who essentially have a very different role than a broker.
For example, liquidity providers on Uniswap can be anyone, given they have the capital to deposit and earn yield, unlike professional market makers in traditional finance whose responsibilities extend beyond that. Providing liquidity on Uniswap is open to anyone to enable permissionless markets, which makes this an important characterization due to the impact it could have on how DeFi functions in the US. While the ongoing crackdown could cause uncertainty in the short term within the Ethereum ecosystem, regulatory clarity will ultimately be reached in the long run, as we’ve seen on several counts of hurdles over the past few years.
Ethereum’s Most Anticipated Application of the Year is Live
EigenLayer is finally live on Ethereum’s mainnet. It’s a new primitive that allows ETH users to “re-stake” their existing staked ETH to validate the security of external networks. EigenLayer has been eagerly anticipated as it optimizes capital efficiency by allowing users to earn additional yield on top of their native staking rewards. Further, it allows younger protocols to borrow the security assurances of Ethereum, circumventing the need to bootstrap their own security from scratch. This translates to a more cost-efficient approach while simultaneously bolstering their decentralization. Nevertheless, the protocol comes with inherent risks.
By opting to earn additional yield, users, and validators subject themselves to heightened smart contract risks as they become exposed to the vulnerabilities of both Ethereum and the additional protocols relying on its security. Moreover, a large portion of ETH could end up being “re-staked” in EigenLayer instead of just validating the security of Ethereum, creating a problem of misalignment. Simply, some validators might opt to maximize their profits by pursuing strategies that prioritize short-term gains over the long-term security of the network. Additionally, the growing enthusiasm for the protocol suggests that a significant portion of the crypto economy might rely on Ethereum’s security. Currently, 15% of all staked ETH is allocated towards Eigen’s re-staking strategy. The continuation of this trend could lead to centralization, posing a risk as Ethereum might inadvertently become a single point of failure over a longer time horizon.
Wide-spread slashing is another concern. In essence, if a substantial amount of ETH is re-staked in a singular protocol, then a slashing event due to unintended or malicious behavior could significantly impact honest ETH stakers. Thus, Eigen proposed a slashing committee comprising esteemed ETH developers and trusted community members, empowered to veto such occurrences and safeguard Ethereum’s integrity.
The final risk concerns a new breed of tokens known as Liquid re-staking Tokens (LRTs), which operate atop EigenLayer. LRTs, akin to Liquid Staking Tokens (LSTs) issued by the established Lido Protocol in 2021, aim to unlock similar capital efficiency by allowing users to use their re-staked ETH as collateral for lending and borrowing. Given that re-staked ETH in Eigen can’t be used across DeFi platforms, users have turned to LRT protocols like Ether.fi and Renzo to seek higher levels of capital flexibility, with their re-staked assets. For context, LRTs grew exponentially by a factor of 28 throughout Q1, increasing from nearly 100K units to the current figure of 2.8M, as shown in Figure 4, illustrating its soaring demand.
Figure 4: Growth of Liquid re-staking Tokens (LRTs) on EigenLayer
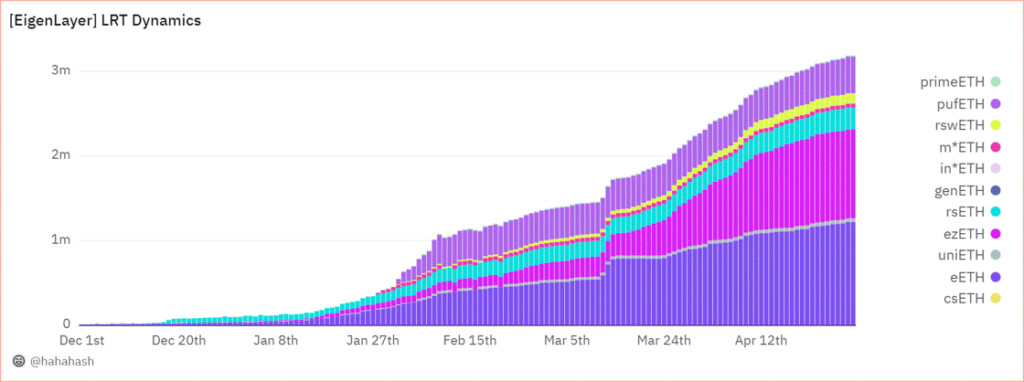
Source: @hahahash on Dune
While LRTs can offer amplified gains through leveraged lending, they can also exacerbate losses, increasing systemic risk in market downturns. Since some LRT protocols can’t offer withdrawals yet, users may be forced to swap their LRT tokens on thinly traded secondary markets, intensifying their decline. Last week, we saw an instance of this risk manifest when Renzo’s ezETH lost its peg. This happened as the ETH derivative experienced heavy selling on various exchanges, causing it to trade at over a 75% discount compared to ETH. This coincided with the company facing scrutiny over its controversial token distribution plan, which is scheduled to launch on April 30.
All in all, the impact of EigenLayer is not to be understated, as the excitement surrounding the new primitive has propelled it to become the second-largest protocol on Ethereum by Total Value Locked (TVL), boasting an impressive $15.6B. This already eclipses the TVL of established players like Solana by fourfold, highlighting the immense adoption that EigenLayer is witnessing despite its brief existence. Further, the excitement building up to its launch since it unveiled its roadmap in March has propelled the Ethereum validator entry queue to its highest level since October. The queue now necessitates a minimum waiting period of 8 days before new validators can join the network, as seen below in Figure 5. Nevertheless, stay tuned as we prepare to release a more in-depth exploration of EigenLayer risks over the coming weeks.
Figure 5: Ethereum Validator Entry Queue in Days

Source: ValidatorQueue
Next Month’s Calendar

Source: Forex Factory, 21Shares
Research Newsletter
Each week the 21Shares Research team will publish our data-driven insights into the crypto asset world through this newsletter. Please direct any comments, questions, and words of feedback to research@21shares.com
Disclaimer
The information provided does not constitute a prospectus or other offering material and does not contain or constitute an offer to sell or a solicitation of any offer to buy securities in any jurisdiction. Some of the information published herein may contain forward-looking statements. Readers are cautioned that any such forward-looking statements are not guarantees of future performance and involve risks and uncertainties and that actual results may differ materially from those in the forward-looking statements as a result of various factors. The information contained herein may not be considered as economic, legal, tax or other advice and users are cautioned to base investment decisions or other decisions solely on the content hereof.


Regulatory Crackdowns and Ethereum’s Most Anticipated Application

ETC Group lanserar BTC1, En unik Core Bitcoin ETP

LITM ETF ger exponering mot litium och batterier
Ombalansering av Valour Digital Asset Basket 10 (VDAB10) inkluderar Toncoin och Shiba Inu Coin

Vad är en utdelnings-ETF?

ETFmarknaden i Europa firar sitt 24-årsjubileum med tillgångar på två biljoner USD

Tillgång till obligationsmarknaden för företagsobligationer från utvecklade marknader

FUIG ETF investerar i hållbara företagsobligationer som följer Parisavtalet

Vilken är den bästa fond som följer Nasdaq-100?

Försvarsfond når förvaltad volym på 500 MUSD
-
 Nyheter2 veckor sedan
ETFmarknaden i Europa firar sitt 24-årsjubileum med tillgångar på två biljoner USD
-
 Nyheter2 veckor sedan
Tillgång till obligationsmarknaden för företagsobligationer från utvecklade marknader
-
 Nyheter4 veckor sedan
FUIG ETF investerar i hållbara företagsobligationer som följer Parisavtalet
-
 Nyheter3 dagar sedan
Vilken är den bästa fond som följer Nasdaq-100?
-
 Nyheter3 veckor sedan
Försvarsfond når förvaltad volym på 500 MUSD
-

 Nyheter4 veckor sedan
Vad händer härnäst för Bitcoin?
-

 Nyheter4 veckor sedan
Ny börshandlad fond från Deka ger tillgång till S&P 500-index
-

 Nyheter2 dagar sedan
De mest populära börshandlade fonderna april 2024