
Nyheter
Much Ado About Zero…

Steep declines in interest rates—to zero or below in several instances—in the face of actual or expected easing across 20 countries, even as the Fed prepares to hike, have sparked a debate about the causes and persistence of this unusual state of affairs. We think this is part of the new operating environment. Meanwhile, pessimism about global growth worsened last quarter, but our views are more upbeat as Europe and Asia benefit from low oil, low rates and weaker FX. We have ratcheted up our forecasts for Europe, where we expect a mild cyclical recovery to persist for a few quarters (thanks to monetary stimulus and a bit of good luck), and Asia too is experiencing a growth acceleration, in China’s Year of the Sheep. The U.S. has had a sluggish start to the year, but is still experiencing a tightening of labor-market conditions.
- Monetary policy divergence. The Federal Reserve is preparing for its rate-hiking cycle, even as central banks in Europe and elsewhere cut their policy rates, sometimes into negative territory.
- Europe’s cyclical rebound. We are seeing a growth improvement in Europe (closer to potential) on low rates and low oil prices, but fiscal support and structural reforms are needed to make the recovery more substantial, while a heavy political calendar could spoil the party.
- Asia’s “sheepish” recovery. The growth impact of the lower oil prices is not yet fully realized, even if the (dis)inflationary impact was rapid. Asian central banks are easing in an effort to stimulate their economies and improve their terms of trade.
Heatmap: Roubini’s end-2015 Nominal Policy Rate Forecasts (%)

Source: Roubini Global Economics
Key Macro Theme 1: Monetary Policy Divergence
The Federal Reserve is preparing for its rate-hiking cycle, even as central banks in Europe and elsewhere cut their rates, sometimes into negative territory.
Rate Cuts Abound
The Federal Reserve and the Bank of England may be preparing to hike their policy rates, but, even with financial stability risks on the radar, 20 other central banks have now cut this year—most notably Switzerland, India (twice), Peru, Turkey (twice), Canada, the European Central Bank, Russia, Australia, Denmark (four times), Sweden, Indonesia, Israel and Poland.
Active or Reactive Policy Making?
So, will central banks’ recent round of frenetic rate cutting, in some cases to sub-zero levels, spur reflation, spending and investment, resulting in growth?
We think not; rather, policy makers have largely been reacting to an exogenous surprise (lower oil prices) that would normally be seen as a positive development, overestimating the risk that swings in volatile food and energy prices will spill over to core prices and impact wage-setting.
PMI readings and other indicators show that the growth scare and market volatility of September-November 2014 were passing phenomena, with growth likely to stay positive. Central Europe, Sweden and Germany have rebounded; despite below-target inflation, these economies are hardly in need of aggressive stimulus.
Among emerging markets, China, India and South Africa stand to benefit from lower energy prices, along with lower rates, while others (Mexico), benefit from U.S. import demand.
Unsurprisingly, Australia, Canada, Russia, Colombia have been hit hard by the commodity-price tumble; rate cuts and weak currencies will cushion the pain of rebalancing. Many emerging- and developed-market central banks are now comfortable with weaker dollar exchange rates.
The U.S. and UK are slowing, but not to the extent yield curves suggest; these imply policy rates will stay below 3% forever. We expect the oil shock to fade from inflation rates in both countries by late 2015, coinciding with the convergence of unemployment rates toward long-term equilibria (the so-called non-accelerating inflation rate of unemployment or NAIRU).
This combination of factors test central bankers’ forward guidance settings, forcing a choice between continued “patience” and the inherent risks of remaining “behind the curve,” as Federal Reserve Chair Janet Yellen’s optimal control path implies.


What to Watch
- U.S. growth: Activity might surprise to the downside (and rate hikes be delayed) if the dollar becomes too strong and global growth is even weaker than our outlook.
- Oil supply adjustment stabilizes prices. This should first be visible in the U.S., as shale producers are relatively flexible.
Key Macro Theme 2: Europe Must Reform to Do Better Than a Cyclical Rebound
We are seeing a cyclical improvement in Europe on low rates and low oil prices, but fiscal and structural reforms are needed to make the recovery more substantial. Fiscal policy is still unsupportive and structural reforms could weigh on growth initially. And the busy electoral cycle raises the risk of “accidents.”
A Rebound, but Only Cyclical
Following the fall in oil prices, the European Central Bank’s announcement of quantitative easing (which implies a weaker euro and lower rates) and the European Commission’s decision to grant countries more leeway on their fiscal balances, the eurozone looks set for a moderate cyclical rebound, which will also support its neighboring economies (the rest of the EU).
Taken together, low oil prices and low interest rates will loosen financial conditions in Europe, encourage consumption (the bloc’s main growth driver) and lead to a boost in net exports.
More Growth Requires Reforms
However, the cyclical upswing will only turn into a more sustained expansion if stronger consumption and more accommodative financial conditions stimulate corporates to invest. That still looks to be only an upside risk, despite the improvement in sentiment indicators.
Notwithstanding the European Commission’s green light for fiscal flexibility, fiscal consolidation and under-investment remain key stumbling blocks across Europe, with Germany, the eurozone’s engine, particularly deficient as policy makers worry about demographic changes that are decades away.
And Watch Out for the Politics
2015 is also a year of European elections, as voters get a chance to kick out those politicians who signed off on austerity measures. Investment will be restrained by the complex geopolitical environment (Russia) and challenging political/electoral cycle—and to a greater degree than market consensus or EU estimates would suggest (especially in Spain).
Greek voters have put the anti-austerity Syriza party in power, and the government’s rocky negotiations with the Eurogroup could set the tone for Spain and other countries. The ongoing game of chicken raises the risk of an accidental policy mistake.
And the UK election in May will also hamper investment. A Conservative victory would set the stage for an EU referendum in 2017, while a Labor win would pose fiscal concerns, neither of which would be positive for investor sentiment.
These trends and the weaker euro put pressure on trading partners (Nordics, Central and Eastern Europe—CEE) to rely on their domestic demand, not exports to the eurozone.


What to Watch
- Elections in Western Europe. Spain and the UK vote, with a real danger of upsetting the traditional order.
- Greek tragedy: Ongoing negotiations risk a “Grexident.”
- The Russia-Ukraine crisis. The crisis could worsen, hampering investment plans in Europe and energy supplies.
- Continued low oil prices. Lower-for-longer prices could help regain some growth momentum, but a weak euro and higher taxes limit pass-through to consumers.
Key Macro Theme 3: Asia’s ‘Sheepish’ Recovery
The growth impact of the lower oil prices is not yet fully realized, even if the inflationary impact was rapid. Asian central banks are easing in an effort to stimulate their economies and improve their terms of trade.
A Modest Recovery
The market’s implied views about GDP growth in Asia have worsened since the release of our last Quarterly Outlook. But our own views for 2015 have grown slightly more constructive on the back of modest monetary easing across the region (especially in China and East Asia), lower tail risks from Europe and greater confidence in our call on the U.S. Recent aggregate PMI data show little in the way of change in output, which is expanding moderately.
Looking ahead, our modelling shows that, while the inflation effects of oil-price declines appear within a few months, the growth effects build over quarters, with the largest impact seen some three to four quarters after the price decline.
Given the pattern of oil-price movements, this implies the growth effects will build through the second half of 2015. Although a net positive, the impact of oil prices across the region is not uniform, with greater boosts to growth likely in the energy-intensive, oil-importing economies of China and India and significant gains (relative to potential GDP) for Japan and South Korea as well.
The impact is negative in Malaysia and likely larger than the forecast changes embedded in the country’s revised budget deficit or assumptions about its external balance.
The East Is Easing (for Now)
Asia, like the rest of the world, has seen a slew of easing moves in the first few months of the year, with most of these shifts prioritizing trade and weaker exchange rates over financial-stability concerns. Local central banks have generally taken advantage of disinflationary forces to cut rates rather than face significant appreciation.
With our growth and inflation forecasts above consensus, we generally foresee less easing ahead than market pricing currently points to. This also implies that some countries that have eased (Korea) will need to reverse course as the Fed begins hiking.


What to Watch
- China’s Q1 activity data: Due mid-April. Will shed light on the implementation of reforms and plans announced at the March National People’s Conference.
- U.S. investment: Stronger U.S. corporate and/or residential investment would boost demand for Asian exports, raising growth rates.
Surveying the Major Economies
United States
The U.S. economy will chalk up another sub-3% expansion in 2015, much as has been the case since the “Great Recession,” although growth should accelerate above that marker in 2016.
Core PCE inflation will slow to 1% y/y in Q2, due to the temporary effects of the rising dollar and collapse in oil prices, but gradually rise in H2, albeit remaining well below the Federal Reserve’s 2% target until Q2 2016. Headline PCE will hit a nadir of 0.2% y/y in Q2 2015, but then move above 2% in 2016 as oil prices rise to $80.
Low core inflation, and little evidence that wage inflation is passing through to consumer prices, will keep the Federal Reserve on hold until at least September, after which it will raise rates as the incoming data warrant. We pencil in 50bps of hikes.
Eurozone
The eurozone will benefit from a cyclical rebound as a result of lower interest rates, the weaker euro, greater fiscal forbearance from the EU authorities and lower oil prices, which may prove temporary. Inflation will remain subdued due to the lagged effects of past euro appreciation and lower oil prices.
The ECB’s QE program implies a weaker euro, likely moving toward parity.
Emerging Europe
The eurozone’s rebound and effects of quantitative easing will have positive spill-overs for emerging European economies, such as in CEE and Turkey, through the financing channel. Inflation will remain extremely low in Eastern Europe, if not in Turkey and Russia.
In Russia, GDP will decline by 3.5% this year followed by modest growth next year. Exports will be the only driver of growth, due to flat oil prices and the ruble. Headline inflation will remain in double digits until mid-2015 and decline to 7% at year-end. We think the central bank will continue its easing cycle, with another 100-basis-point cut in April.
We do not expect the conflict in Ukraine to be resolved in 2015. Europe is unlikely to extend further sanctions in the near term, but sanctions will not be removed either, as that would require unanimity.
Asia/Pacific
Asia is set for a modest recovery in the Chinese Year of the Sheep, slightly exceeding market expectations on the back of a burgeoning output effect from lower oil prices, Japan’s slow climb out of recession and policy easing in China, India and Indonesia.
The divergence that characterized much of the region’s 2014 performance will likely diminish this year, absent unforeseen shocks. The oil-price decline is a net positive for all Asia/Pacific countries save Malaysia.
Latin America
Lower oil prices, lower rates and a slower start to the year suggest more moderate growth for Latin America in 2015, with consumers leading the way and investment lagging. Regional growth should accelerate in 2016 as Brazil exits its recession and investment takes over from consumption as the region’s main growth driver.
Tighter fiscal policy at the national and sub-national levels will drag on growth, softening labor markets and hitting state-owned energy companies and sub-sovereign bonds. Fiscal drag and spare capacity will temper the inflationary pressures engendered by weaker currencies.
U.S. demand will support exports elsewhere in the region, while weaker currencies will help narrow external deficit gaps. The lagged impact of cheaper oil on global consumption will only feed through later in 2015.


Asset-Class Implications: Fixed Income
United States
A number of factors are preventing long-dated U.S. Treasury yields from rising, most notably the persistently low German bund and Japanese government bond yields. With the Fed funds rate still near zero, higher yields can be costlessly hedged or be combined with the dollar’s steady appreciation. Geopolitical tensions have compounded this, with investors seeking safety.
Although a number of upside risks (including higher oil prices and faster wage growth) suggest long-dated Treasury yields will eventually rise, we think they will remain low for longer than in a typical recovery, and expect the 10y yield to end 2015 at 2.5%.
Europe
In line with this our view on the U.S., we expect UK gilt yields to rise, with the 10y yield reaching 2.1% by year-end and the curve flattening further, unless the Bank of England joins the tacit global currency war and postpones its own rate hikes to 2016.
German bund yields will remain compressed due to a combination of flight to safety, the European Central Bank’s aggressive easing and the lack of a credible plan to reflate the eurozone. We expect the 10y yield to remain well below 1% this year. At the shorter end, bund yields will likely fall further into negative territory, thus widening the 5y U.S. Treasury-bund spread to over 200 basis points by year-end.
In the Nordics, the 10y Swedish government bond-bund spread should narrow toward zero. And in Switzerland, short-term rates will become even more negative this year, dragging down the longer end.
The convergence trend with Central and Eastern Europe (CEE) bond markets looks largely played out. Aside from Turkey, where political interference has recently pushed bonds lower, local rate easing looks well priced in and CEE bonds are expensive. The best return might well be found in Russian local debt, where we expect more cuts (400 basis points) than markets seem to be pricing in, meaning the moderate RUB depreciation should be offset by yield compression.
The exclusion of Russian external debt from Barclay’s indexes, risks to weaker oil prices and significant spread compression since end-January (close to 200 basis points, from over 700) suggests a negative view, despite low issuance.
A credit event is well priced into Ukrainian debt and we expect the first round of restructuring will be far from the 75% face-value reductions that are likely necessary for economic sustainability. A failure to finalize the IMF deal by summer would make a disorderly default likely.
Asia/Pacific
Long-dated Japanese government bonds, which recently sold-off when the Government Pension Investment Fund finally started to move from government bonds into riskier assets, will remain compressed on the back of the Bank of Japan’s redoubled easing, which we expect in the middle of this year.
We believe the short end of the Aussie curve is too steep, as stronger growth will lead the Reserve Bank of Australia to cut rates by less than the market expects.
We like paying 5y interest rate swaps (IRS) in South Korea and Hong Kong and receiving U.S. 5y IRS since there is no economic basis for Korean or Hong Kong rates to trade lower than U.S. rates five years from now.
Latin America
We expect only moderate upward pressure on government bond yields as the Federal Reserve embarks on its gradual rate hikes. Although the short ends of some yield curves need to rise, as is the case with Mexico’s, most curves are already steep.
Meanwhile, the market’s expectation of over 100 bps in additional hikes in Brazil looks excessive to us, while fiscal adjustment should support the longer-end of the yield curve, leading to further inversion.


Asset-Class Implications: Equities
Global Equity
Our macro outlook—modest growth acceleration and very low inflation coupled with continued easy policy—remains supportive for equity. However, valuation no longer offers enough cushion against uncertainty. That said, near-term downside risk—and the market’s perception of it—appears to be falling.
As in our last Quarterly, we still see 2015 as a year of single-digit returns, and with higher volatility than in the past two years.
We see higher upside potential in markets outside the U.S. and within more cyclical sectors, but differentiation based on the risks around our base-case macro outlook is the key to finding value.
U.S.
We expect the S&P 500 to end the year at 2150, driven primarily by earnings-per-share growth. An already below-average earnings risk premium coupled with the coming rate hikes and associated uncertainty suggest multiple expansions are unlikely.
The rallying dollar represents a strong headwind against international revenue and oil-exposed large-cap firms relative to more domestically oriented small caps. Our expectation of domestic cyclical outperformance relative to global cyclicals (in addition to the oil-related boost to consumers) supports small-cap outperformance. Moreover, rising rates have historically been supportive of small-cap outperformance.
That said oil-related pressures on the credit market offset this to a degree. With relative valuation around the long-term average, we expect small caps to marginally outperform the S&P 500.
Europe
We have upgraded our view on eurozone equities, which should benefit from the cyclical rebound. The tactical 15-20% rally (on quantitative easing) that we were expecting could last longer, although the geopolitical tensions and still sub-par earnings suggest being cautious about the durability. Swedish equity, already at all-time highs, will probably benefit from the Riksbank’s easing, as would Danish equities in the event of the central bank there making a similar move. Swiss equities will likely eventually recover from the abandonment of the FX floor, given they tend to trade in euro rather than Swiss franc.
We have turned positive on Russian equity (versus emerging markets overall), on reduced macro tail risks and extremely depressed valuations. Meaningfully tighter sanctions (unlikely) and significant oil price weakness (Brent in the low $40s) are two key downside risks. We continue to find value in Polish equity, given resilient domestic growth, monetary easing and Poland’s exposure to German consumption.
Asia/Pacific
The forthcoming oil-related boost to GDP growth in much of the region and the “sheepish” recovery in China should provide a better backdrop for North Asian equity markets, which have lagged their southern neighbors so far this year. We particularly favor South Korea, where valuations are unchallenging and domestic sentiment is miserable, but a tax on retained earnings should prompt higher dividend payouts and share buybacks.
In Japan, more monetary easing and the Government Pension Investment Fund’s increased allocation to equities should continue to push up share prices.
We remain cautious on the Thai stock market despite its rally and the Street’s upgraded view of the country’s growth prospects. King Bhumibol Adulyadej’s health is clearly failing, and his backers could not win a free and fair election after his passing.
Latin America
Mexican equities are the stand out, as they boast an attractive CDS-adjusted valuation and are backed by a positive macro story (now the oil-related froth has come out of the market).
The outlook for Brazilian equities is not yet attractive, as high real rates and sluggish domestic demand make bonds a more attractive bet. Catalysts for a possible reversal include fiscal adjustment, signs the Petrobras crisis is nearing resolution and indications the central bank could begin to ease rates.
Asset-Class Implications: Commodities
Policy stimulus in Europe and Asia in particular are likely to drive demand for commodities higher. China, a key consumer of most commodities, is likely to see its growth surprise to the upside. Despite targeting a lower level of economic growth, stimulus activity should lift commodity intensive infrastructure spending higher. Weak oil prices should spur activity in Asia driving the demand for most commodities higher. Energy will likely remain a weak-spot in the near-term although a modest rebound in oil prices will be felt in the latter half of the year as supply begins to tighten.
Industrial metals, platinum and palladium
We expect demand for industrial metals and platinum and palladium (which have high industrial usage) to benefit from the stimulus-driven cyclical rebound.
Supply of most industrial metals is tighter than commonly perceived. Copper for example has been in a supply deficit for the past 3 years, despite the International Copper Study Group’s forecast for surplus in each of those years. We believe that the surplus forecasts for this year are equally ill-founded.
Elsewhere ore export bans (nickel from Indonesia) and risk of mine closures (zinc, aluminium, platinum and palladium) could tighten supply further this year.
Gold
Gold is likely to continue to feel the weight of rising interest rates in the US. However, currently the price of gold over-estimates the pace of that tightening, and gold can offer a relatively cheap hedge against some of the tail risks of policy mistakes that may occur as the rise of anti-establishment political parties in Europe threatens to challenge the status quo.
Silver
Despite seeing uplift in demand from its industrial applications, silver’s close correlation with gold will temper its price gains. Additionally excess mine supply will continue to weigh on price.
Oil
The oil price war continues to rage on. While oil rigs in the US are being shut off at an unprecedented rate, oil inventories continue to increase. We expect US crude oil output to fall around June. The major oil benchmarks WTI and Brent could therefore fall further before recovering later in the year.
The June OPEC meeting remains a pivotal point in the political game that this price war has become. We think that the cartel will decide to cut production but with significant reluctance. The cuts will be modest as the group will be unwilling to lose market share and will wait for other producers to reduce output before making any deeper cuts.
Natural Gas
We remain bearish on natural gas as seasonal demand will drop off in the coming quarter. The beginning of the ‘injection’ season will see the accumulation of inventories which will keep the market well supplied.

Agriculture
We expect wheat, corn and soy planting intentions to fall after a prolonged period of weak prices. After last year’s near-perfect weather conditions, we are unlikely to see production this year match the highs seen last year. As a result, lower supply is likely to be a supportive influence for grains prices.

The so-called “currency wars” have taken a toll on agricultural prices. The rapidly depreciating Brazilian Real has encouraged sales of coffee and sugar, depressing global prices of these commodities. A shift back to fundamentals should bode well for coffee prices given the likely poor coffee yield this year. As speculative shorts have become quite crowded, there is potential for a short-covering rally if the Brazilian Real firms. The same cannot be said for sugar, which will likely go into its fifth year of supply surplus.
Asset-Class Implications: Currencies
The pervasiveness of negative interest rates as a policy tool across Europe has led to widespread G10 currency weakness against the US Dollar. The USD index reached the highest level in 12 years last week, and alongside record speculative long positioning, the rally appears stretched. The USD’s rally is being driven by the continuation of the US economic recovery and investor expectations for tighter policy from the Fed, in stark contrast with those for other major central banks.
Despite removing the much publicised ‘patient’ approach toward policy normalisation, the Fed remains pragmatic. Indeed, little has changed on the economic front: outside of the latest solid jobs report, other economic indicators have been relatively soft. Meanwhile wage growth remains weak and household spending has moderated recently. Despite improving economic activity, inflation indicators have begun to trend lower. As a result, we feel there is scope for a modest reversal in the USD rally.
While market expectations currently indicate that the Fed will hike rates around July/August, we feel this is priced into current USD cross rates. With the USD Index indicating that the current strength of the rally has moved out of line with interest rate differentials the risk is skewed towards a near-term USD correction.

The British Pound has been the main European beneficiary of the accommodative policy from European central banks. The pound has strengthened considerably as the ECB has been forced to pursue a full blown QE policy to offset deflationary forces. The rise in GBP has come at a time that expectations have been sharply unwound that the Bank of England would begin to tighten policy in 2015. Hawkish members of the MPC have become dovish as low oil prices and sluggish economic activity has pushed inflation to zero for the first time on record. The fading UK economic momentum is expected to continue to force the GBP lower against the USD, but against the Euro the outlook is more favourable and we expect further appreciation.
While the ECB and the BOJ are dominating the front lines of the currency wars, there have been some casualties. The Swiss National Bank lost its balance sheet battle with the market as the ECB’s QE programme threatened to overwhelm its resources. Despite the removal of the floor for EUR/CHF, the SNB expects its move further into negative territory for rates ‘is set to have a corrective effect on the Swiss franc’s’ overvaluation. We expect that CHF is unlikely to attain the floor 1.20 level again in 2015 unless more concerted action is taken by the SNB.
Elsewhere in Europe, the combination of QE and low/negative rates has also been used to counter the appreciation of the Swedish Krona, by the Riksbank, in a bid to ward off the threat of deflation. We expect that this supportive stance from the Swedish central bank will continue to have a deflating effect on SEK.
G10 rates are very accommodative

Meanwhile, its Nordic neighbour has seen the Norwegian Krone remaining under pressure as oil prices continue to struggle against the weight of abundant global supply. Nonetheless, the lacklustre performance of commodity prices has taken a backseat role for currencies that are highly leveraged to commodity trade, like the AUD, CAD, NOK and NZD. Thus far, central bank policy has been the main performance driver for G10 currencies and we expect this to continue over the coming quarter. Going into the second half of the year, we expect commodity prices to respond to rising demand we believe aggressive supply expectations will begin to unwind. With stronger commodity market fundamentals reasserting control, we expect some greater buoyancy for commodity currencies, particularly NOK and CAD, which are strongly tied to oil prices.
Over the longer term we expect the USD rally to resume, with the Euro and Yen likely to be the underperformers after near-term strength. Both central banks (ECB and BOJ) have committed to aggressive QE programs and the flood of liquidity is likely to keep these currencies under pressure as any tightening of policy is not expected ahead of 2016 at the earliest.
The above content is offered for the exclusive use of RGE’s clients. No forwarding, reprinting, republication or any other redistribution of this content is permissible without expressed consent of Roubini Global Economics, LLC. All rights reserved. If you have received access to this content in error, RGE reserves the right to enforce its copyright and pursue other redress. RGE is not a certified investment advisory service and aims to create an intellectual framework for informed financial decisions by its clients. This content is for informational purposes only and does not constitute, and may not be relied on as, investment advice or a recommendation of any investment or trading strategy. This information is intended for sophisticated professional investors who will exercise their own judgment and will independently evaluate factors bearing on the suitability of any investment or trading strategy. Information and views, including any changes or updates, may be made available first to certain RGE clients and others at RGE’s discretion. Roubini Global Economics, LLC is not an investment adviser.
For questions about reprints or permission to excerpt or redistribute RGE content, or for a PDF version, clients should contact their RGE account representative.
Important Information
This communication has been issued and approved for the purpose of section 21 of the Financial Services and Markets Act 2000 by ETF Securities (UK) Limited (“ETFS UK”) which is authorised and regulated by the United Kingdom Financial Conduct Authority (the “FCA”).


I en nyligen genomförd Coindesk-intervju lyfte Blackrock fram institutionaliseringen av tillgångsklassen eftersom de förväntar sig en ny våg av investerare, särskilt från stats- och pensionsfonder, som är redo att öka efterfrågan under de kommande månaderna. Som nämnts regelbundet för våra läsare, är denna dynamik precis vad vi förväntar oss och vi ser denna institutionalisering som en viktig drivkraft för kryptotillgångar som kryptoindex ETPer.
Utveckling (USD) i slutet av april 2024
Beta Index ETP – Nasdaq Crypto Index Europe ETP (HASH eller HDX1): April -16%, YTD +35% och 12m +87%.
Smart-Beta Index ETP – Crypto Momentum Factor Index ETP (HAMO eller HDXM): April -23%, YTD -3% och 12m +60%.
Marknadsuppdatering
Efter 7 månader av uppgångar i rad såg kryptomarknaden sin första nedgång sedan augusti 2023, med Nasdaq Crypto Index Europe (”NCIE”) som sjönk med 16% i april, men bibehöll en ökning med 35% för året. Trots globala geopolitiska utmaningar är utsikterna för kryptotillgångar fortsatt positiva, främst drivna av ett fortsatt institutionellt intresse.
April markerade den mycket efterlängtade bitcoin-halveringen, som såg att gruvbelöningarna halverades, vilket underströk dess utbud och efterfrågan. Historiska trender tyder på en effekt efter halvering, nu förstärkt av framsteg i amerikanska ETF-flöden. Vårt forskarteam har fördjupat sig djupare i detta fenomen i vår rapport: Hashdex Research – Bitcoin’s Halving: An investor’s guide.
NCIE i förhållande till andra tillgångsslag
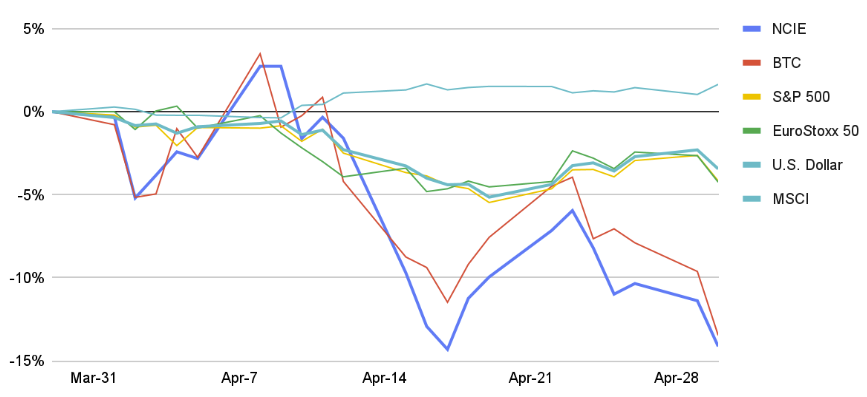
Källa: Hashdex, per den 30/04/24.
I det globala sammanhanget stötte index över olika tillgångsklasser på en utmanande månad. Oro för potentiellt förlängda höga räntor i USA ledde till marknadsturbulens, vilket resulterade i negativa utfall över nästan alla index. Av särskild betydelse var S&P 500, som noterade en nedgång på över 4 % för månaden.
April månad
- Nasdaq Crypto Index Europé
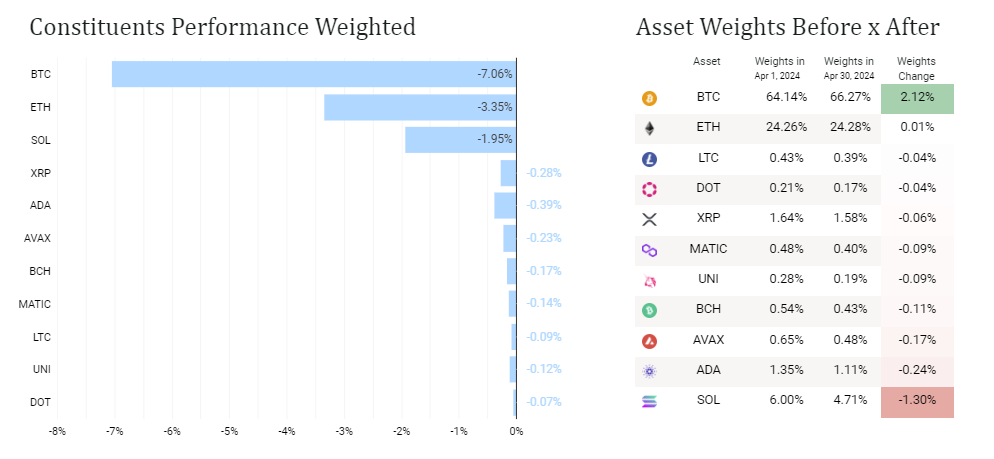
Källa: Hashdex, per den 30/04/24.
Indexet påverkades övervägande av Bitcoin och Ethereum, och upplevde nedgångar på -13,4% respektive -18,6%. Samtidigt såg alla andra komponenter i NCIE fall över 24%. Uniswap, i synnerhet, drabbades av betydande turbulens efter ett meddelande från SEC:s Enforcement Division till Uniswap Labs, vilket resulterade i en brant minskning med 42 %.
- Crypto Momentum Factor Index:
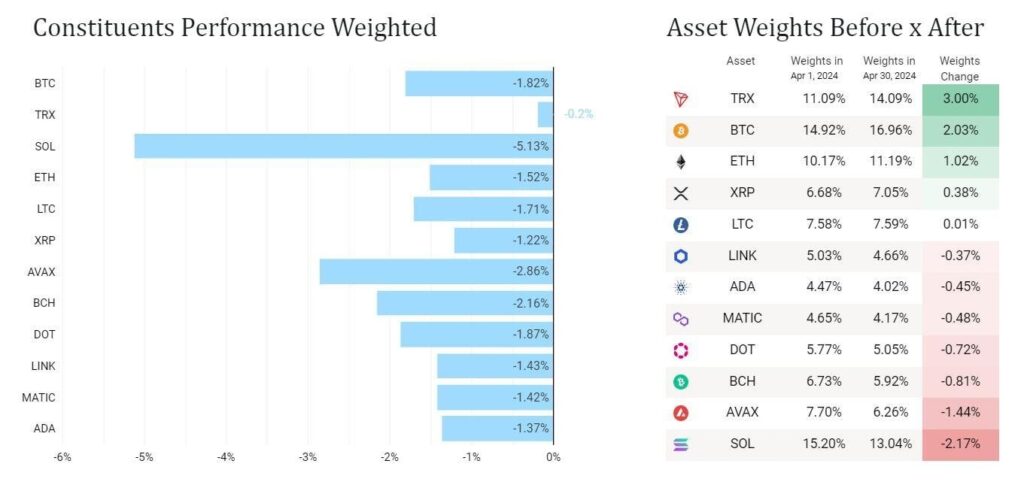
Källa: Hashdex, per den 30/04/24.
In i maj, med sin månatliga ombalansering, lade Momentum Index till en ny tillgång: NEAR Protocol, en decentraliserad utvecklingsplattform som använder en Proof-of-Stake (PoS) konsensusmekanism, kommer att introducera en sönderdelad arkitektur för förbättrad transaktionskapacitet. Hittills har priset stigit med 68 % i år.
3 månaders daglig avkastning korrelation Nasdaq Crypto Index Europe vs S&P 500
Källa: Hashdex, per den 30/04/24.
Hashdex Nasdaq Crypto Index Europe ETP – dokumentation
ISIN: CH1184151731 / Tickers: HASH (SIX och Euronext) eller HDX1 (Xetra) – handlas i USD, EUR, CHF och GBP
Hashdex Crypto Momentum Factor ETP – dokumentation
ISIN: CH1218734544 / Tickers: HAMO (SIX och Euronext) eller HDXM (Xetra) – handlas i USD, EUR, CHF och GBP

• Bullish, Bearish, or Both? Macro Mayhem Leads to Bitcoin Volatility
• Bitcoin’s Institutional Embrace is Accelerating
• Beyond Borders and Banks: Stablecoins Proving their Market Viability
Macro Mayhem Leads to Bitcoin Volatility
Last week, Bitcoin navigated a wave of conflicting U.S. macroeconomic events. The FOMC press conference last Wednesday confirmed the Fed will sustain high interest rates at 5.25-5.5% as the challenge of achieving the inflation target persists. As shown in Figure 1, this initially triggered Bitcoin’s price to drop by 5.9% as investors sought the safety of fixed-income assets. Friday’s U.S. Jobs report reversed the negative sentiment from the FOMC meeting. The report revealed a disappointing labor market, with only 175,000 non-farm jobs added, as unemployment rose to 3.9%. This data fueled hopes for rate cuts, which bodes well for risk-on assets, which led to Bitcoin rebounding by 6.7% to ~$63,000 by week’s end.
Figure 1: Bitcoin 1 Week Price Performance (April 29, 2024 – May 6, 2024)
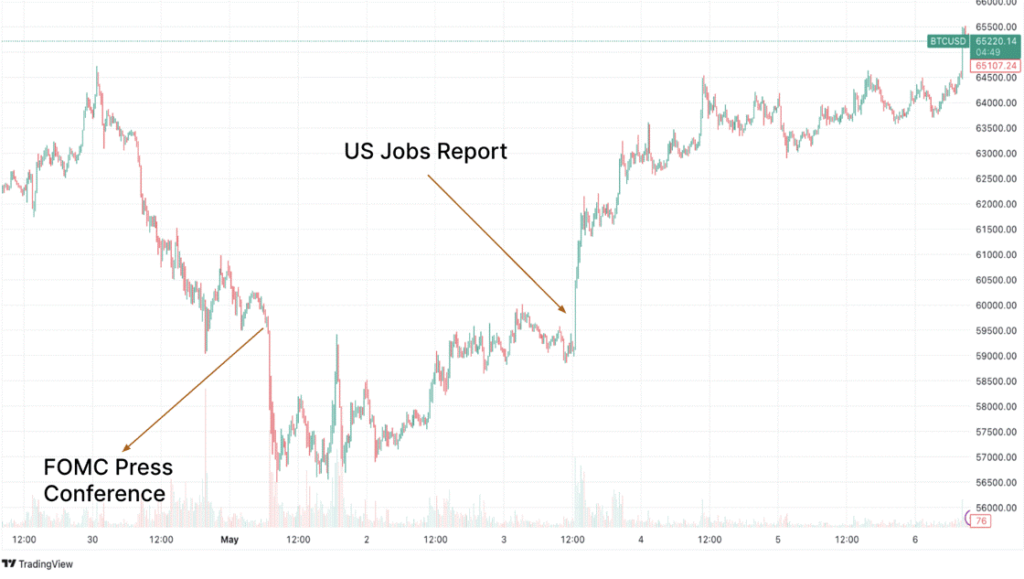
Source: TradingView
Looking ahead, several developments could provide tailwinds for Bitcoin. The upcoming Treasury buyback program, the first since 2002, is launching on May 29 and has several implications for the broader financial landscape. By conducting weekly bond buybacks of up to $2 billion, outstanding debt is reduced while liquidity is increased, which could allow capital to flow into riskier assets. The reduced bond supply also puts downward pressure on yields, potentially making Bitcoin more attractive.
The recent Treasury refinancing announcement also looks promising for Bitcoin. A lower target balance for the Treasury General Account (TGA) suggests the government needs to borrow less, which frees up capital. The impact could be compared to quantitative easing, instead of withdrawing liquidity from the market by selling new bonds, the Treasury effectively injects liquidity by not needing to borrow as much. This additional liquidity eventually reaches the banking system, potentially leading to easier access to credit and lower interest rates. As we have voiced throughout, this environment would benefit riskier assets like Bitcoin.
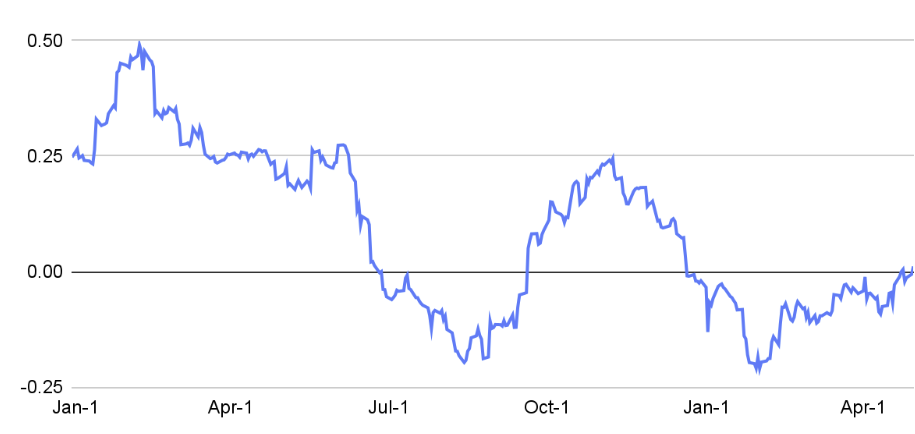
Despite the initial price drop triggered by the Fed’s hawkish stance on interest rates, Bitcoin’s resilience was evident in its subsequent rebound driven by a weakening labor market and the potential prospect of a dovish shift. As illustrated below, Bitcoin’s funding rate is now similar to when it was trading at around $29,000, which signals a healthy market adjustment, shedding excess leverage. Looking ahead, the upcoming Treasury actions will undoubtedly affect U.S. liquidity and interest rate levels, which are key to Bitcoin’s performance and will be closely monitored in the coming weeks.
Figure 2: Bitcoin’s Funding Rate

Source: Glassnode
Bitcoin’s Institutional Embrace is Accelerating
Fueled by the U.S. Bitcoin ETF launch, the institutional adoption of Bitcoin is accelerating. A staggering $175 billion is estimated to be held by ETFs, countries, and public and private companies, representing roughly 15% of the total Bitcoin supply. While miniscule compared to the U.S. launch, Hong Kong’s Bitcoin ETFs further exemplify this trend, accumulating 4.2K BTC, or nearly $270 million, within their first week of trading. This showcases the growing appetite for the asset, however the hunger for Bitcoin is not limited to Hong Kong. Ovata Capital Management’s $60 million allocation into the U.S. spot ETFs underscores this trend, which is set to continue as the May 15 deadline for 13F filings approaches, which may reveal previously undisclosed positions held by institutions.
Recent disclosures by BNY Mellon and BNP Paribas, along with Swiss funds Bellecapital International and Lugano Financial Advisors, provide further evidence of Bitcoin’s institutionalization. Moreover, according to BlackRock, the world’s largest sovereign wealth funds (SWFs), including Norway’s $1.6 trillion fund, Saudi Arabia’s Public Investment Fund, and Kuwait’s Investment Authority, are re-initiating discussions around Bitcoin. The SWF industry is valued at $11.6 trillion, therefore even a moderate allocation into the asset could see demand catapult to new levels, and provide a tipping point for broader adoption. Importantly, it is becoming more difficult to discount the asset – Bitcoin’s unique profile as both a risk-on and risk-off asset is becoming increasingly relevant given the complex macroeconomic landscape.
Further, Bitcoin’s adoption is transcending passive investment strategies. For instance, fintech giant Nubank, housing 80 million users, now offers crypto deposits and withdrawals, aiming to bridge the gap between traditional finance and crypto in Latin America. Lastly, Microstrategy, synonymous with their commitment to Bitcoin, are pushing the boundaries further by building an identity solution on the Ordinals network. This exemplifies the use of Bitcoin beyond a decentralized payment system, a notion we have echoed in the past weeks as Bitcoin continues to evolve beyond its original purpose.
Finally, the coming weeks promise further clues on the US economic trajectory and Bitcoin institutional adoption. There are eight Fed speaker events this week, and while they don’t directly address crypto, they often offer valuable insights into the current economic conditions. This, coupled with the turbulence expected during Q1 earnings season, could create volatility in equity markets, which may spill over to crypto as investors react accordingly.
Beyond Borders and Banks: Stablecoins Proving their Market Viability
After a six-year hiatus, Stripe is re-entering the crypto industry by enabling customers to accept stablecoins for online payments. Stripe was among the pioneers in integrating Bitcoin back in 2014. However, they ceased support in 2018 due to Bitcoin’s prolonged processing times and high transaction costs, which didn’t present a significant improvement over its traditional counterpart. Since then, the industry has undergone a major transformation, with the emergence of numerous smart-contract platforms and scaling efforts, enhancing the potential of crypto’s infrastructure to offer a superior user experience.
For instance, Stripe’s co-founder showcased a $100 USDC payment using Solana at the company’s annual conference. The demo corroborated how the payment was processed in less than a second instead of days while incurring $0.0037 in network fees, a cost reduction of almost 800-fold compared to a credit card. This is a testament to the advancements achieved by the latest generation of platforms, such as Solana, which addressed some of the drawbacks, like high transaction costs and lengthy processing times, while demonstrating their efficacy for use cases requiring a high volume of interactions, such as payments.
To that end, Stripe will begin supporting USDC payments through Ethereum, Solana, and Polygon. This integration marks a significant milestone, given Stripe’s substantial 35% market share in the payments industry. However, it’s even more crucial as users can seamlessly leverage the efficiencies of crypto’s infrastructure, ensuring reduced transaction costs and notably swifter processing times while remaining unaware of the use of blockchain technology in the backend. This mirrors how users are often unaware of the payment infrastructure their preferred fintech apps utilize. At 21Shares, we firmly believe that this kind of seamless integration is imperative for the widespread adoption of crypto.
That said, while Tether leads by market capitalization with $110 billion compared to USDC’s $33 billion, USDC actually dominates in terms of usage when looking at transaction volume. According to Visa’s latest on-chain analytical dashboard aiming to dissect the growth of the stablecoin sector, USDC is now responsible for more than 70% of all stablecoin payments, as illustrated below. As we’ve emphasized for years, exemplified by our own work on Dune, on-chain analytics represents the future of capital markets. It offers unparalleled transparency and real-time data access, unlike traditional industries reliant on periodic disclosures of quarterly financials. Therefore, Visa’s active engagement in on-chain analytics marks a watershed moment, reaffirming our long-held belief that this is the path forward.
Figure 3: Stablecoins Monthly Transaction Volume
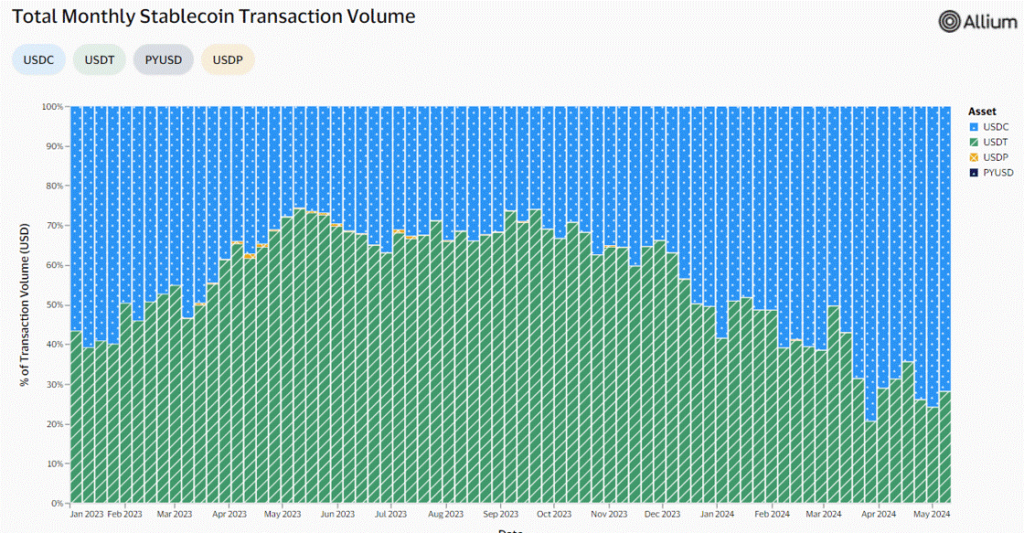
Source: Alluvium X Visa
Despite USDC’s widespread adoption, Tether has achieved remarkable financial success in Q1. The company raked in a staggering $4.52B in profits by strategically deploying user deposits into U.S. treasury and repurchase agreements. The exposure to debt, coupled with rising Bitcoin and Gold prices, has proven to be a lucrative formula. As a result, Tether’s net profit now eclipses that of financial giants like Citibank, Goldman Sachs, and Morgan Stanley, highlighting the burgeoning business potential of the fiat-backed stablecoin model.
Further, characterized by its disintermediated structure and emphasis on user experience, stablecoins have proven themselves as a viable alternative within the financial landscape. They are arguably one of crypto’s most compelling use cases right now. Its significance becomes even more apparent in regions facing economic instability, where users turn to stablecoins as a swift means to access the U.S. dollar, safeguarding themselves against currency devaluation. Turkey serves as a notable case study, stablecoin transactions account for a remarkable 4% of the nation’s GDP, the highest proportion globally, at a time when the Turkish Lira lost more than 75% of its value against the U.S. dollar over the last 5 years.
Finally, Tether is intensifying its efforts by launching USDT on the TON blockchain, which is closely linked to Telegram. Despite TON’s recent rise in popularity with approximately 1.74M users, it aims to tap into Telegram’s vast 900M user base through its deep integration. This move could significantly expand the market for stablecoins, currently serving around 25M users. Moreover, this integration is a pivotal step in simplifying crypto usage, concealing its complexities, and paving the way for mass adoption.
This Week’s Calendar

Source: Forex Factory, 21Shares
Research Newsletter
Each week the 21Shares Research team will publish our data-driven insights into the crypto asset world through this newsletter. Please direct any comments, questions, and words of feedback to research@21shares.com
Disclaimer
The information provided does not constitute a prospectus or other offering material and does not contain or constitute an offer to sell or a solicitation of any offer to buy securities in any jurisdiction. Some of the information published herein may contain forward-looking statements. Readers are cautioned that any such forward-looking statements are not guarantees of future performance and involve risks and uncertainties and that actual results may differ materially from those in the forward-looking statements as a result of various factors. The information contained herein may not be considered as economic, legal, tax or other advice and users are cautioned to base investment decisions or other decisions solely on the content hereof.


Utvecklingen för Hashdex kryptoindex ETPer

XD5E ETF en utdelande fond som köper aktier från Eurozonen
Bitcoin’s Volatility and Stablecoin’s Market Viability: What Happened in Crypto This Week?

Endast en tredjedel av brittiska privatinvesterare har hört talas om ansvarsfulla investeringar eller ESG

C3AE ETF spårar det kinesiska A 300 Swap indexet

ETFmarknaden i Europa firar sitt 24-årsjubileum med tillgångar på två biljoner USD

Tillgång till obligationsmarknaden för företagsobligationer från utvecklade marknader

Vilken är den bästa fond som följer Nasdaq-100?

De mest populära börshandlade fonderna april 2024

Försvarsfond når förvaltad volym på 500 MUSD
-
 Nyheter3 veckor sedan
ETFmarknaden i Europa firar sitt 24-årsjubileum med tillgångar på två biljoner USD
-
 Nyheter3 veckor sedan
Tillgång till obligationsmarknaden för företagsobligationer från utvecklade marknader
-
 Nyheter2 veckor sedan
Vilken är den bästa fond som följer Nasdaq-100?
-
 Nyheter1 vecka sedan
De mest populära börshandlade fonderna april 2024
-
 Nyheter4 veckor sedan
Försvarsfond når förvaltad volym på 500 MUSD
-

 Nyheter4 dagar sedan
Några av de bästa guldfonderna
-

 Nyheter2 veckor sedan
U.S. Global Investors tar över HANetf Travel
-

 Nyheter4 veckor sedan
Bygg din egen pengamaskin