Följ oss

Nyheter

Setting the Stage for the Next Gold Bull Market

Publicerad

den

Market Review - Setting the Stage for the Next Gold Bull Market. The gold market moved to the beat of the Federal Reserve’s (the “Fed”) rate hike signal drumming in May.

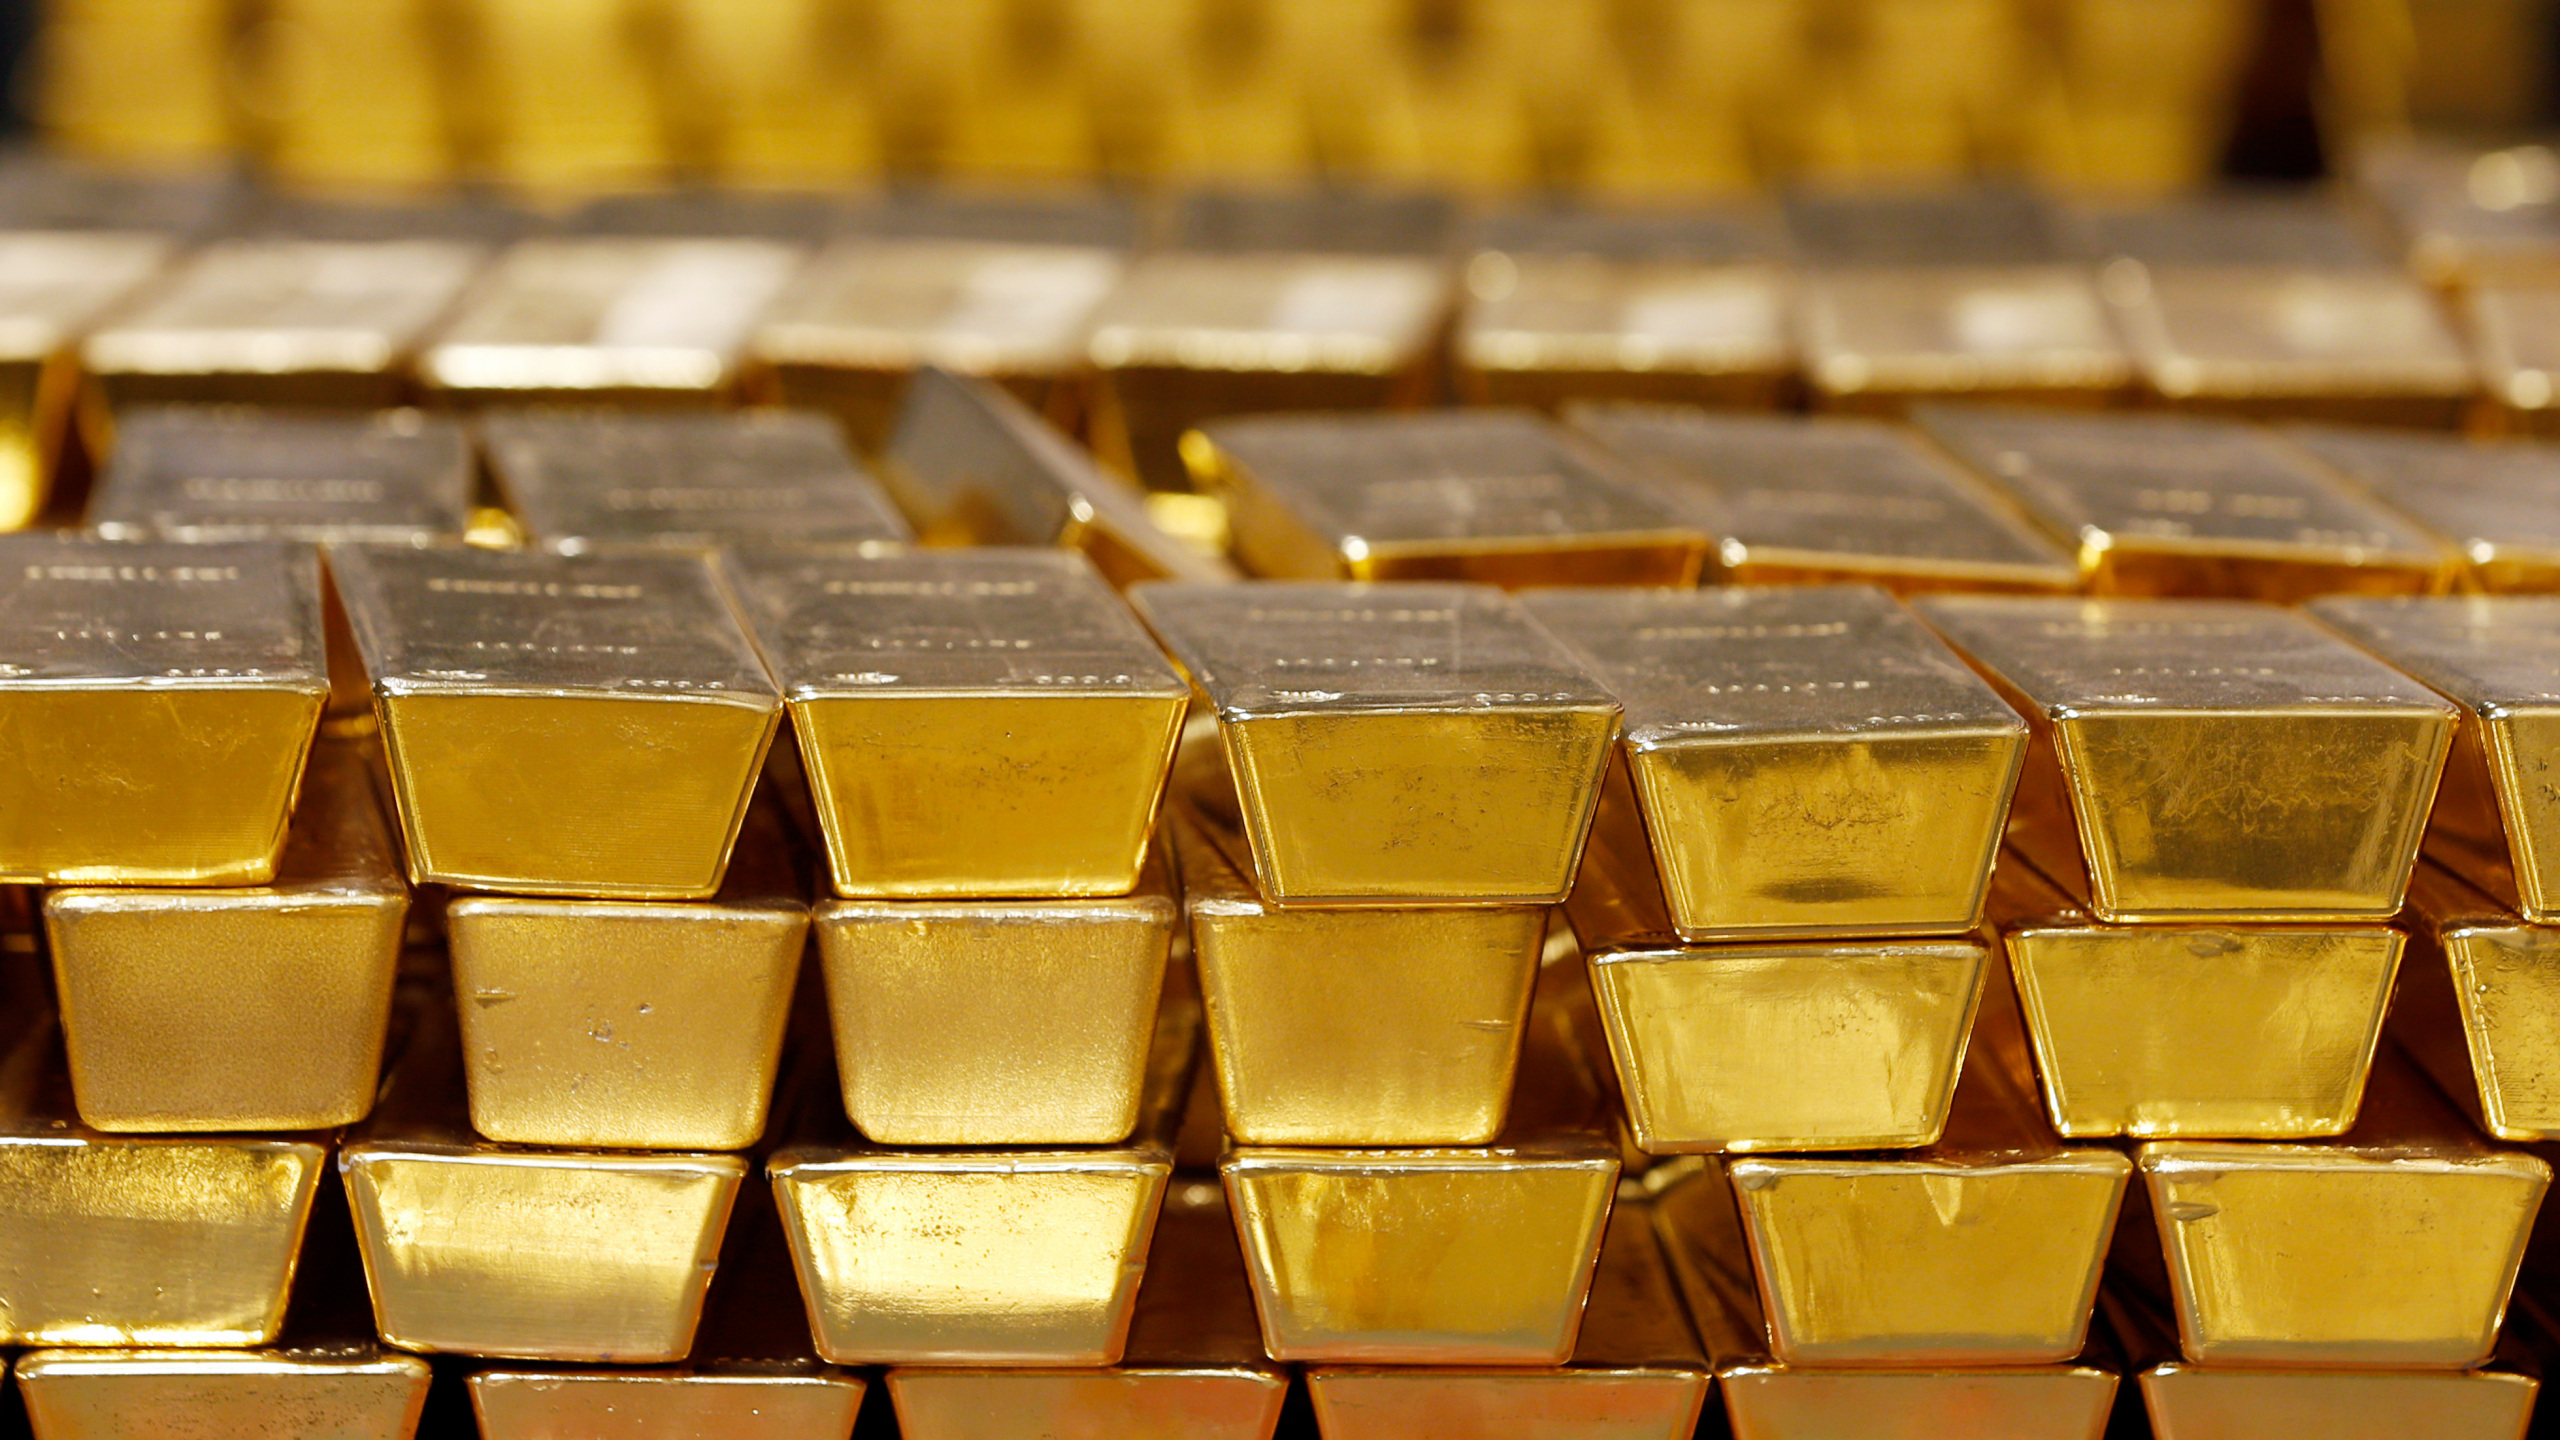
Market Review – Setting the Stage for the Next Gold Bull Market. The gold market moved to the beat of the Federal Reserve’s (the “Fed”) rate hike signal drumming in May. At the beginning of May, the probabilities of a rate increase, as implied by the federal funds futures markets1, were 12% for an increase in June and 26% for a July increase. That dropped to 4% for June and 19% for July by May 16. On May 18, the market interpreted the minutes from the Federal Open Market Committee (the “FOMC”) April meeting as being more hawkish than anticipated and market expectations of rate increases in June and July jumped to 32% and 47%, respectively. Gold traded down for nine consecutive sessions following the release of the minutes. Gold dropped to an intra-day low of $1,199 per ounce on May 30, and ended the month at $1,215 per ounce for a loss of 6.0% or $77.66.

The U.S. dollar, which historically has a strong negative correlation2 with the gold price, also reflected the market’s assessment of a rate hike this summer, with the U.S. Dollar Index (DXY)3 ending May up 3% for the month. The change in market sentiment regarding upcoming Fed rate decisions was primarily driven by comments from Fed Chair Janet Yellen and other Fed officials. Meanwhile, U.S. economic data releases continued to be mixed, and, in our view, do not paint a clear picture of the U.S. economy that would favor further tightening in the near term. Positive April economic data included retail sales and existing and new home sales coming in above expectations, and an increase in the ISM Manufacturing Index4 reading for May that was widely expected to be declining. In contrast, employment data and construction spending were below expectations while the University of Michigan Sentiment Index5, Consumer Confidence Index6 and manufacturing activity in Chicago and Dallas for May were all weaker than expected.

But the most impactful, in our opinion, economic data was the May jobs report announced by the U.S. Department of Labor on June 3. Reported figures were massively below expectations, showing the lowest number of workers added in six years. While market chatter before the report’s release may have suggested the Fed had everyone convinced of a summer hike, a hike was not priced in for June, as evidenced by the 20% implied probability. The chance of a July hike was only at 53.6%. Immediately after the jobs report, those probabilities dropped to 4% and 29% respectively, the DXY index fell (down 1.7%) and gold rallied (up 2.8% or $33 per ounce), closing at $1,244 per ounce on June 3.

With gold falling in May, gold stocks underperformed. The NYSE Arca Gold Miners Index (GDMNTR)7 fell 11.9%, and the MVIS Global Junior Gold Miners Index (MVGDXJTR)8 dropped 11.5% during the month, trimming gains for the year to 65% and 76% respectively, as of May 31, compared to gold’s gain of 14.5%.

Of note, the amount of gold held by global gold bullion exchange traded products (ETPs) increased by an additional 4.8% during the month of May. Holdings of global gold ETPs have increased almost 27% this year to an estimated 59.5 million ounces of gold, still well below the 2012 peak of more than 84 million ounces.

Market Outlook

We have been of the opinion that the Fed may not be as aggressive as previously guided, and that rising rates in 2016 could be a significant impediment to the U.S. economy. The June 3 jobs report missed expectations by a wide margin. In May, the U.S. added just 38,000 workers, compared to the median of 160,000 as forecasted by Bloomberg. Job gains for prior months were downgraded as well. This indicates a weakening labor market and reduces the odds of Fed rate increases in the coming months.

We believe this is another important inflection point for gold that suggests the early stages of a new bull market. The gold price has been consolidating in the $1,200 to $1,300 per ounce range since early March, hitting a low of nearly $1,200 per ounce on May 30. It now appears as if gold is poised to remain above the technically and psychologically important $1,200 per ounce level. While it is not uncommon for the gold price to struggle in the summer months, we believe gold is forming a new base. We expect to see higher gold prices as the year progresses. Gold Price Monthly Return Average, 1971-2015 and 2016

vaneck

Source: Bloomberg, Scotiabank GBM

We met the management of approximately 20 gold companies during the month, which allowed us to get a good sense of what’s happening in the sector. The main takeaway is that while companies are still focused on efficiencies, cost savings and operating improvements to help maximize cash flow, higher gold prices this year have shaped the conversation around what to do with these new cash levels.

For some companies, paying down debt still remains a priority. For firms currently building new mines, the higher cash flows provide welcomed cushion and remove market concerns over financing. Most companies also expect dividends to resume and/or increase as free cash flow grows. But for most companies, higher cash flows, at a time when balance sheets are in good shape and costs are under control, will likely bring back the opportunity to add future growth.

Valuations are still relatively low, so there is opportunity to buy assets. Exploration spending, which had been significantly reduced over the last couple of years, should also pick up again, allowing companies to add resources and reserves and increasing their chances of finding new discoveries. Projects that have been shelved will be revisited as financing becomes available. We met with management teams that despite the higher gold price, and higher cash flows that come with it, remain firmly committed to growing profitability and returns rather than production. We heard more than once in our discussions, that a new ounce of production is only good and will only be added if it improves or maintains the existing per ounce profitability of the company. Companies are measuring growth in free cash flow per share, for example, rather than production volumes.

This is very encouraging to us. Company initiatives have slowly and cautiously started to shift from mere survival to thriving. Cautiously is the key word here. As they embark on what may be the next gold bull market, we believe gold companies need to continue to demonstrate a rigorous capital allocation strategy that focuses on value creation for shareholders and positions the gold mining equity sector in the investable universe of the broader market.

by Joe Foster, Portfolio Manager and Strategist

With more than 30 years of gold industry experience, Foster began his gold career as a boots on the ground geologist, evaluating mining exploration and development projects. Foster is Portfolio Manager and Strategist for the Gold and Precious Metals strategy.

Fortsätt läsa
Annons
Klicka för att kommentera

Skriv en kommentar

Din e-postadress kommer inte publiceras. Obligatoriska fält är märkta *

Nyheter

BlackRock utökar utbudet med nya fonder för statsobligationer

Publicerad

den

BlackRock lanserar igår ytterligare fyra nya fonder för statsobligationer, iShares iBonds ETFer baserade på statsobligationsexponeringar, vilket utökar iShares utbud av UCITS ETFer med fast löptid till 13 fonder, nu med löptider från 2025 till 2029. Denna lansering är första gången BlackRock erbjuder iShares iBonds exponerade mot Europeiska statsskulden.

BlackRock lanserar igår ytterligare fyra nya fonder för statsobligationer, iShares iBonds ETFer baserade på statsobligationsexponeringar, vilket utökar iShares utbud av UCITS ETFer med fast löptid till 13 fonder, nu med löptider från 2025 till 2029. Denna lansering är första gången BlackRock erbjuder iShares iBonds exponerade mot Europeiska statsskulden.

iBonds är ETFer som beter sig på samma sätt som obligationer och förfaller på ett definierat datum. Fonderna har en diversifierad uppsättning obligationer med liknande förfallodatum. Efter en bestämd period kommer ETFerna att mogna och återbetala en slutlig utbetalning till investerarna. Fonderna ger kostnadseffektiv tillgång till obligationsmarknaden, med diversifiering, transparens och likviditetsfördelar med ETFer.

Denna lansering ger ytterligare löptider i amerikanska statsskulder till iBonds-intervallet, december 2027 och 2029. Dessutom breddar denna lansering alternativen för investerare genom att erbjuda tillgång till italienska statsskulder över löptiderna 2026 och 2028. Italienska statsobligationer ger för närvarande den högsta avkastningen bland euroområdets obligationer. De nya fonderna ger investerare flexibilitet över valutor, löptider och länder.

iBonds ETFer kan användas av investerare för att komplettera befintliga investeringsinstrument, i en lättförståelig struktur, som syftar till att uppnå avkastning genom en kombination av kapitaltillväxt och inkomsten på fondens tillgångar som härrör från de underliggande obligationernas kupongbetalningar. ETF-sviten kan också användas för att lägga till skala till obligationsportföljer som erbjuds av investeringsrådgivare och förbättra den operativa enkelheten. Varje iBonds ETF har en diversifierad korg av obligationer och kan ersätta ett stort antal innehav, vilket minimerar behovet av att köpa och hantera enskilda obligationer. iBonds är tillgängliga via förmögenhetsförvaltningsplattformar, inklusive digitala, och mäklarhus över hela Europa.

Investerare kan också använda dessa UCITS iBonds för att bygga skalbara, diversifierade obligationstrappor. Genom att köpa obligationer med olika förfallodatum kan investerare förskjuta slutliga utbetalningar och återinvestera i fonder med efterföljande löptider – skapa obligationstrappor. Den unika strukturen hos iBonds ETFer gör det lättare att skapa dessa obligationstrappor med endast ett fåtal ETF:er, snarare än att handla med många obligationer. Investerare kan använda dem för att strukturera sina investeringar för att uppfylla kortsiktiga mål och fånga upp definierade avkastningar över fastställda investeringsperioder.

BlackRock har en mer än 13 år bevisad meritlista i att hantera iBonds och ETFer med fast löptid, efter att ha lanserat 86 iBonds ETFer. I EMEA hade iBonds UCITS ETFerna en accelererad och väl mottagen lansering med över 3 miljarder USD insamlade sedan augusti 2023 över 9 produkter med olika löptider.

”iBonds ETFer är designade för att mogna som en obligation, handla som en aktie och diversifiera som en fond, allt i ett kostnadseffektivt och transparent ETF-omslag. När poolen av iBonds UCITS ETFer växer kommer investerare att kunna njuta av ytterligare mångsidighet, vilket gör det möjligt för dem att kurera portföljer för att möta deras behov, säger Karina Schmitt Lund, chef för Wealth Management och iShares för Baltikum, Norden och Nederländerna.

”De bygger på framgångarna för Treasury iBonds i USA, och dessa nya iBonds ETFer ger ytterligare valmöjligheter och utökar tillgången för européer till inkomsterna från både amerikanska och italienska statsobligationer.”

NamniShares iBonds Dec 2027 Term $ Treasury UCITS ETFiShares iBonds Dec 2029 Term $ Treasury UCITS ETFiShares iBonds Dec 2026 Term € Italy Govt Bond UCITS ETFiShares iBonds Dec 2028 Term € Italy Govt Bond UCITS ETF
Kortnamn27IT29IT26TP28IY
IndexICE 2027 Maturity US Treasury UCITS IndexICE 2029 Maturity US Treasury UCITS IndexICE 2026 Maturity Italy UCITS IndexICE 2028 Maturity Italy UCITS Index
Avgift %10 bps10 bps12bps12bps
BasvalutaUSDUSDEUREUR
ISINIE0006UGU3X3IE00076HZIP3IE000LZ7BZW8IE000Q2EQ5K8
Förfall2027202920262028
SFDR classificationArticle 6Article 6Article 6Article 6
BörsEuronext AmsterdamEuronext AmsterdamXetraXetra

Fortsätt läsa

Nyheter

5PAH ETF spårar S&P500 och hedgar sig med säljoptioner

Publicerad

den

Global X S&P 500 Annual Tail Hedge UCITS ETF USD Accumulating (5PAH ETF) med ISIN IE000HGH8PV2 strävar efter att spåra Cboe S&P 500 Annual 30% (-5% till -35%) Buffer Protect-index. Cboe S&P 500 Annual 30% (-5% till -35%) Buffer Protect-index spårar resultatet för S&P 500 samtidigt som man använder säljoptioner i ett försök att buffra investerare mot 30% av förlusterna efter de första 5% av förlusterna vardera år. Buffertstrategin kommer med nackdelen att möjliga värdevinster är begränsade.

Global X S&P 500 Annual Tail Hedge UCITS ETF USD Accumulating (5PAH ETF) med ISIN IE000HGH8PV2 strävar efter att spåra Cboe S&P 500 Annual 30% (-5% till -35%) Buffer Protect-index. Cboe S&P 500 Annual 30% (-5% till -35%) Buffer Protect-index spårar resultatet för S&P 500 samtidigt som man använder säljoptioner i ett försök att buffra investerare mot 30% av förlusterna efter de första 5% av förlusterna vardera år. Buffertstrategin kommer med nackdelen att möjliga värdevinster är begränsade.

ETFens TER (total cost ratio) uppgår till 0,50 % p.a. Global X S&P 500 Annual Tail Hedge UCITS ETF USD Accumulating är den enda ETFen som följer Cboe S&P 500 Annual 30 % (-5 % till -35 %) Buffer Protect index. ETF:n replikerar resultatet för det underliggande indexet syntetiskt med en swap. Utdelningarna i den börshandlade fonden ackumuleras och återinvesteras.

Denna ETF lanserades den 7 november 2023 och har sin hemvist i Irland.

Skäl att överväga 5PAH

Hantera risk. Genom att använda en definierad utfallsstrategi strävar fonden efter att ge en buffert på 30 % på S&P 500, efter de första 5 % av förlusterna på samma index.

Tillväxtpotential. Fonden gör det möjligt för investerare att delta i tillväxten av S&P 500, upp till ett tak.

Potentiell riskminskning. Genom sin definierade utfallsstrategi ökar fonden potentialen att minska nedåtriktade aktier inom en strategisk allokering.

Sammanfattning av ETF

Global X S&P 500 Annual Tail Hedge UCITS ETF (5PAH) strävar efter att replikera avkastningen från S&P 500 Annual 30% (-5% till -35%) Buffer Protect Index, upp till ett tak, samtidigt som investerarna buffrar mot 30% av förlusterna efter de första 5 % av de årliga förlusterna. Fonden strävar efter att uppnå detta resultat genom att köpa och sälja säljoptioner och sälja out-of-the-money köpoptioner på samma index.

ETFens mål

Global X S&P 500 Annual Tail Hedge UCITS ETF (5PAH) strävar efter att replikera investeringsresultaten som generellt motsvarar pris- och avkastningsutvecklingen, före avgifter och kostnader, för Cboe S&P 500 Annual 30% (-5% till -35) %) Buffer Protect index.

Handla 5PAH ETF

Global X S&P 500 Annual Tail Hedge UCITS ETF (5PAH ETF) är en europeisk börshandlad fond. Denna fond handlas på flera olika börser, till exempel Deutsche Boerse Xetra och London Stock Exchange.

Det betyder att det går att handla andelar i denna ETF genom de flesta svenska banker och Internetmäklare, till exempel DEGIRONordnet, Aktieinvest och Avanza.

Börsnoteringar

BörsValutaKortnamn
Borsa ItalianaEURSPAH
London Stock ExchangeGBPSAHP
London Stock ExchangeUSDSPAH
XETRAEUR5PAH

Största innehav

KortnamnNamnVikt (%)
AAPLAPPLE INC7.30
MSFTMICROSOFT CORP7.30
AMZNAMAZON.COM INC3.40
NVDANVIDIA CORP3.20
GOOGLALPHABET INC CL A2.10
METAMETA PLATFORMS INC CLASS A2.00
GOOGALPHABET INC CL C1.80
BRK.BBERKSHIRE HATHAWAY INC CL B1.70
TSLATESLA INC1.70
UNHUNITEDHEALTH GROUP INC1.30

Innehav kan komma att förändras

Fortsätt läsa

Nyheter

Tillgång till USAs sektorrotationsstrategi baserad på Barclays Shiller Cape Ratio

Publicerad

den

Sedan i tisdags är en ny börshandlad fond utgiven av Ossiam handlas på Xetra och Börse Frankfurt. Ossiam Shiller Barclays CAPE US Sector Value UCITS ETF (EUPC) i andelsklassen USD ger investerare tillgång till USAs sektorrotationsstrategi. Detta syftar till att identifiera undervärderade branscher baserat på Shillers pris-till-förtjänst-förhållande (CAPE-kvot).

Sedan i tisdags är en ny börshandlad fond utgiven av Ossiam handlas på Xetra och Börse Frankfurt. Ossiam Shiller Barclays CAPE US Sector Value UCITS ETF (EUPC) i andelsklassen USD ger investerare tillgång till USAs sektorrotationsstrategi. Detta syftar till att identifiera undervärderade branscher baserat på Shillers pris-till-förtjänst-förhållande (CAPE-kvot).

CAPE-kvoten är en konjunkturjusterad pris-till-vinst-kvot och är lika med aktiekursen dividerat med den inflationsjusterade genomsnittliga vinsten under de senaste tio åren.

Detta värderingsmått används för att identifiera undervärderade företag och utvidgas här till aktiesektorer. En månatlig rotation väljer ut de fem mest undervärderade sektorerna baserat på den relativa CAPE-kvoten. Sektorn med minst fart är dessutom utesluten. De återstående fyra sektorerna viktas lika.

NamnISINAvgifterUtdelningspolicyReferensindex
Ossiam Shiller Barclays CAPE US Sector Value TR – UCITS ETF 1C (USD)LU10798415130,65 %AckumulerandeShiller Barclays CAPE US Sector Net TR Index

Produktutbudet i Deutsche Börses XTF-segment omfattar för närvarande totalt 2 154 ETFer. Med detta urval och en genomsnittlig månatlig handelsvolym på cirka 14 miljarder euro är Xetra den ledande handelsplatsen för ETFer i Europa.

Fortsätt läsa

Populära