
Nyheter
Is US wage growth finally stepping out?
The calendar keeps flying by, and kicking off Q4 economic data, investors recently received the US October employment situation report. The money and bond markets have ‘graduated’ of sorts, and the typical headlines regarding the unemployment rate and new job creation have been rendered more secondary in importance at this point of the cycle, with wages now moving to centre stage. According to the latest jobs report from the Bureau of Labour Statistics (BLS), average hourly earnings (AHE), on a year-over-year basis, broke out of its recent range, begging the question; is US wage growth finally stepping out to the upside?
Without a doubt, the one ‘sticking point’ that seems to have alluded the US Federal Reserve (Fed) in their policy outlook has been the lack of any significant wage growth. Sure, the path of AHE has been on the positive side of the ledger, but the trajectory, or pace of the upside movement, has appeared to have confounded market participants.
Figure 1: Average hourly earnings

Source: Bureau of Labour Statistics, as of 2 November 2018
The graph above highlights how the year-over-year rate of increase for AHE had been locked in a rather narrow band of roughly +2.5%-+2.8% since the end of 2015. It seemed as if every time there was a surprise to the upside, the following month or so reversed this performance, rendering any unexpected gain as a ‘false start’. However, over the last three months, the BLS has reported that the AHE annualized gain has twice hit the ‘+3%’ threshold, and in the case of the just released October data, the +3.1% increase represented the best showing since early 2009.
With two out of last three months producing ‘3’ handles for AHE growth, investors may finally be witnessing the long-awaited upside momentum in wages. As we have seen in prior episodes, the trajectory may not always be a straight-up move to the upside, but it does look as if progress is being made on this front. The scope of wage growth throughout various industries was also encouraging, an important point to consider because it can help to rule out the dreaded ‘aberrational’ result which tends to ultimately get cancelled out in future reports.
Conclusion
While the United States Treasury (UST) market did sell-off a bit on response to this data, the back-up in the UST 10-year yield was not necessarily noteworthy, nor did it signal any newfound concerns on the inflation front just yet. Inflation expectations, as measured by ‘breakeven’ spreads were only modestly higher after the jobs report. The bond market and the Fed have been down this road before and will more than likely wait to see the ‘whites of the eyes’ of sustainable wage growth before responding. In fact, this is just the type of result the Fed has long been waiting for. However, developments on the wage front will need to be monitored closely, because any upside surprises to this data, or inflation in general, is not currently factored into UST 10-year yields.
This material is prepared by WisdomTree and its affiliates and is not intended to be relied upon as a forecast, research or investment advice, and is not a recommendation, offer or solicitation to buy or sell any securities or to adopt any investment strategy. The opinions expressed are as of the date of production and may change as subsequent conditions vary. The information and opinions contained in this material are derived from proprietary and non-proprietary sources. As such, no warranty of accuracy or reliability is given and no responsibility arising in any other way for errors and omissions (including responsibility to any person by reason of negligence) is accepted by WisdomTree, nor any affiliate, nor any of their officers, employees or agents. Reliance upon information in this material is at the sole discretion of the reader. Past performance is not a reliable indicator of future performance.


• Bitcoin reverses sharply from oversold levels following the dovish FOMC meeting last week
• Our in-house “Cryptoasset Sentiment Indicator” has rebounded sharply from very bearish levels and currently signals neutral sentiment again
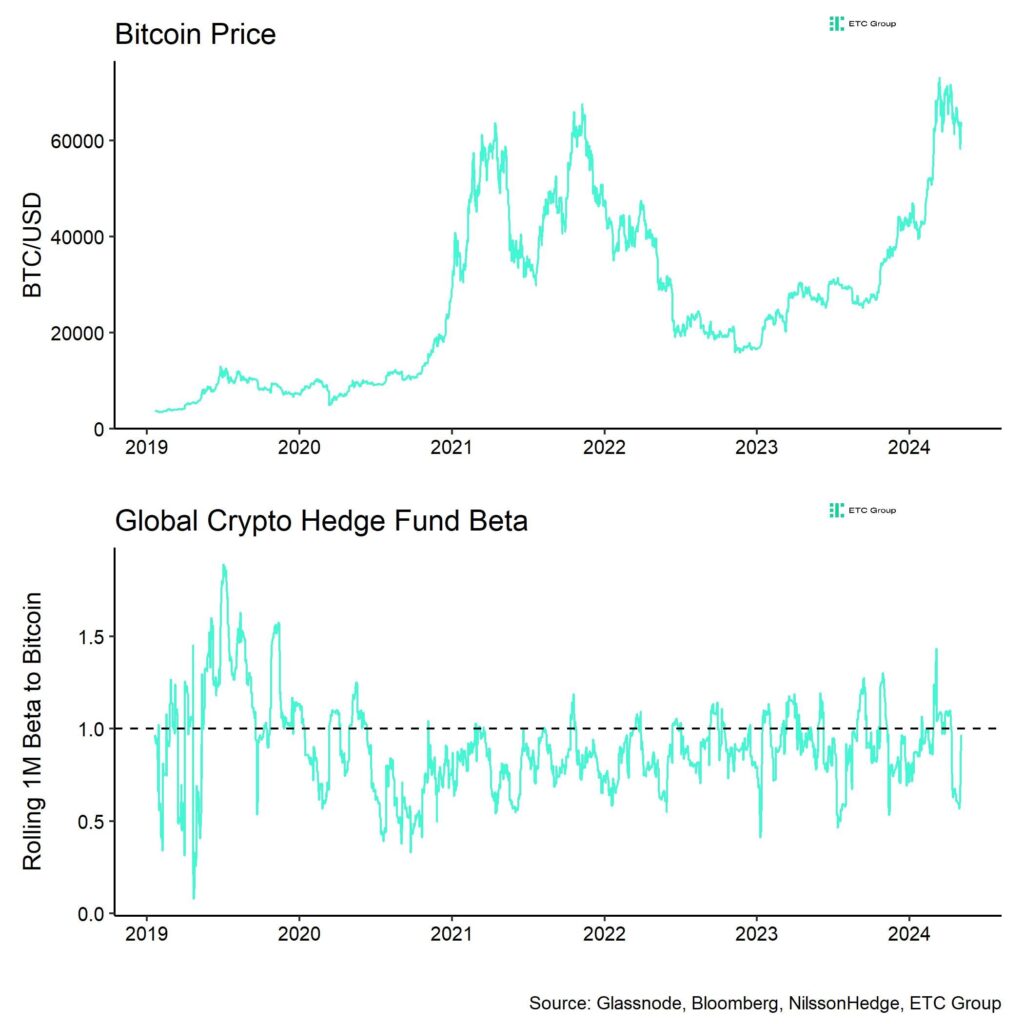
• Crypto hedge fund’s beta implies that crypto hedge funds have significantly increased their market exposure to Bitcoin from underweight to neutral levels over the past week
Chart of the Week
Performance
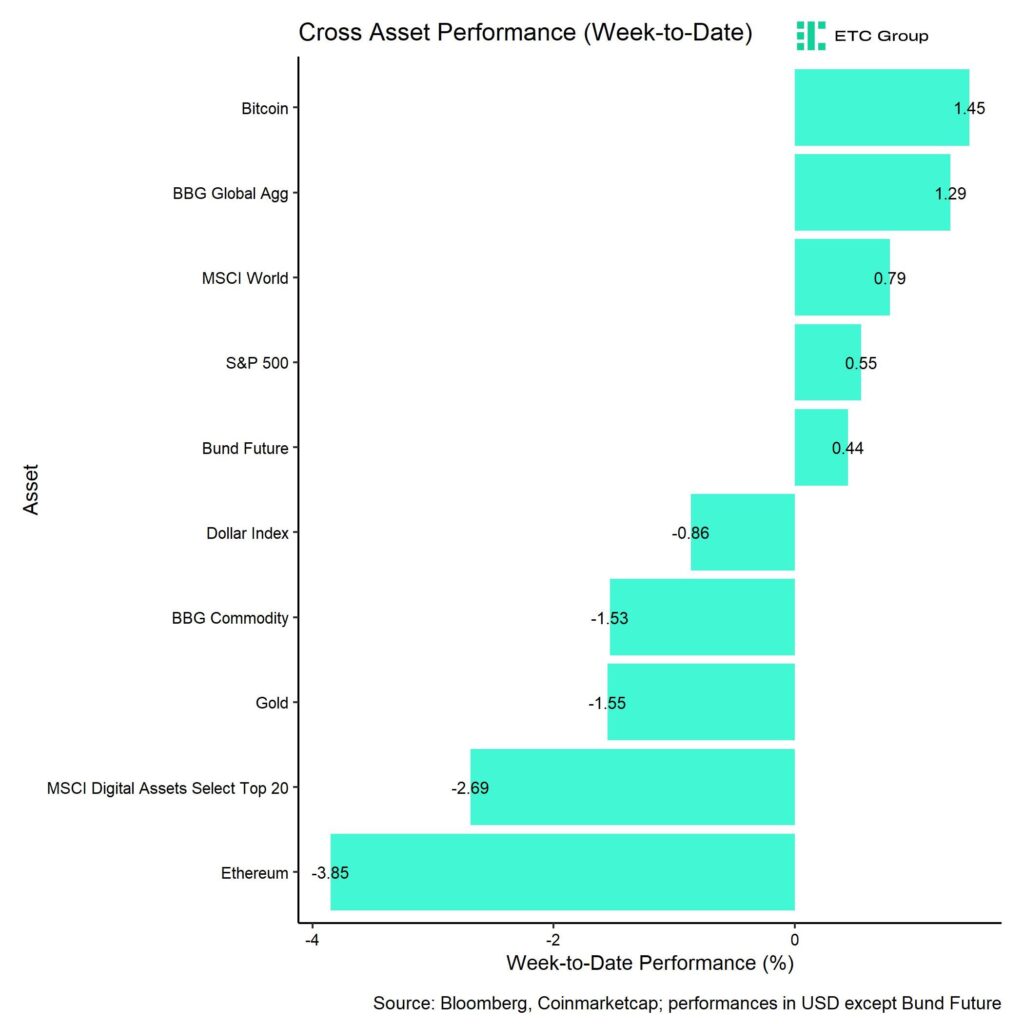
Last week, cryptoassets rebounded from very oversold levels as macro sentiment and risk appetite improved following the latest FOMC meeting.
More specifically, the Fed has started tapering its Quantitative Tightening by announcing that the limit of US Treasury bond redemptions will be reduced from 60 bn USD per month to 25 bn USD per month starting in June. The market interpreted this announcement as a signal that the Fed is inching closer towards an eventual monetary policy easing cycle.
The reversal in overall risk appetite was further supported by weak US labour market data that were released last Friday. Non-farm payroll growth came in well below consensus expectations and the US unemployment rate remained at cycle highs.
This increased the probability of looser monetary policy by the Fed which is bullish for cryptoassets.
As a result, Bitcoin rebounded sharply from very oversold levels in crypto sentiment.
We had already indicated that further downside was limited due to the very bearish levels in the Cryptoasset Sentiment Index .
Since then, we saw a very sharp reversal in crypto hedge fund’s beta that implies crypto hedge funds have on aggregate significantly increased their market exposure from underweight to neutral levels over the past week (Chart-of-the-Week).
Besides, there was also a sharp increase in whale BTC balances over the past week as well.
All in all, this implies that institutional investors seem to have bought the recent dip in cryptoassets.
Meanwhile, overall ETP fund flows into cryptoassets still remained relatively weak over the past week. A bright spot were the new Hong Kong spot Bitcoin and Ethereum ETFs that had a combined net inflow of around +224.1 mn USD last week. However, this was not enough to offset negative ETP flows in other jurisdictions, predominantly in the US.
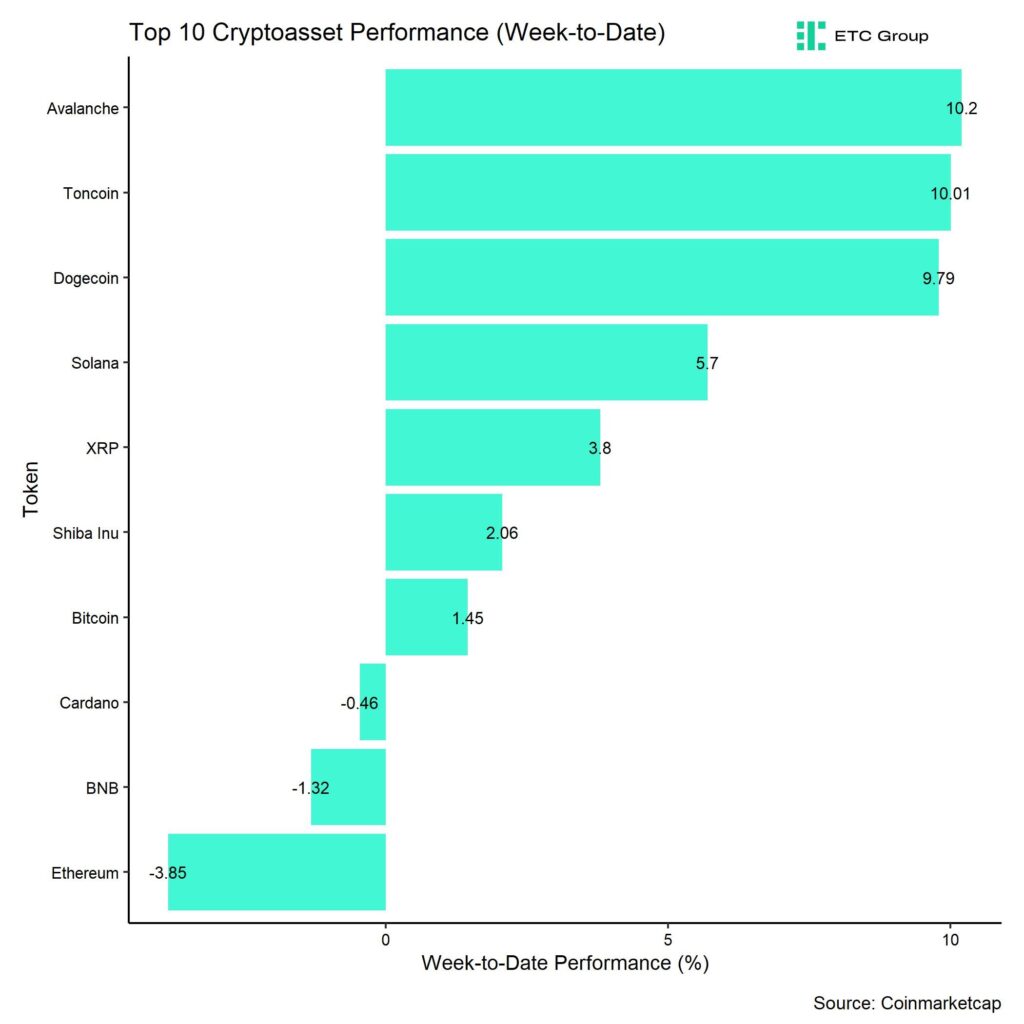
In general, among the top 10 crypto assets, Avalanche, Toncoin, and Dogecoin were the relative outperformers.
However, overall altcoin outperformance vis-à-vis Bitcoin remained relatively low, with only around 45% of our tracked altcoins managing to outperform Bitcoin on a weekly basis.
Sentiment
Our in-house “Cryptoasset Sentiment Index” has rebounded sharply from very oversold levels. The index is currently signalling neutral sentiment again.
At the moment, 8 out of 15 indicators are above their short-term trend.
Last week, there were significant reversals to the upside crypto hedge fund’s beta to Bitcoin and global crypto ETP fund flows.
The Crypto Fear & Greed Index signals ”Greed” again as of this morning. It had shortly dropped to “Fear” levels last week.
Performance dispersion among cryptoassets has continued to decline amid the recent reversal in cryptoassets. Overall performance dispersion among cryptoassets remains relatively low.
Altcoin outperformance vis-à-vis Bitcoin was only moderate, with around 45% of our tracked altcoins that have outperformed Bitcoin on a weekly basis. At the same time, there was a slight underperformance of Ethereum vis-à-vis Bitcoin last week.
In general, increasing (decreasing) altcoin outperformance tends to be a sign of increasing (decreasing) risk appetite within cryptoasset markets.
Meanwhile, sentiment in traditional financial markets has not yet rebounded, judging by our own measure of Cross Asset Risk Appetite (CARA).
Fund Flows
Last week, we saw continued net outflows from global crypto ETPs with around -372.4 mn USD (week ending Friday) based on Bloomberg data.
A bright spot were the new Hong Kong spot Bitcoin and Ethereum ETFs that had a combined net inflow of around +224.1 mn USD last week according to data provided by Bloomberg. However, this was not enough to offset negative ETP flows in other jurisdictions, predominantly in the US.
Global Bitcoin ETPs continued to see net outflows of -409.1 mn USD of which -433.0 mn (net) were related to US spot Bitcoin ETFs alone. The newly issued Hong Kong spot Bitcoin ETFs were able to attract +156.2 mn USD in net inflows last week according to data provided by Bloomberg.
The ETC Group Physical Bitcoin ETP (BTCE) also saw net outflows equivalent to -15.2 mn USD last week.
The Grayscale Bitcoin Trust (GBTC) continued to experience net outflows of approximately -277.2 mn USD last week. That being said, last week Friday saw the very first daily net inflow into GBTC since its conversion to an ETF in January of around +63.0 mn USD which is a positive sign.
In contrast to Bitcoin ETPs, Global Ethereum ETPs saw a reversal in ETP flows last week, with net inflows of around +25.2 mn USD. This was mostly due to significant inflows into the newly issued Hong Kong spot Ethereum ETFs that were able to attract +67.9 mn USD last week, according to data provided by Bloomberg.
Meanwhile, the ETC Group Physical Ethereum ETP (ZETH) saw small net outflows (-0.9 mn USD). The ETC Group Ethereum Staking ETP (ET32) had neither share creations nor redemptions (+/- 0 mn USD) last week.
Besides, Altcoin ETPs ex Ethereum AuM’s were mostly stable last week with only minor net inflows of around +0.9 mn USD.
Besides, Thematic & basket crypto ETPs also experienced some net inflows of +10.6 mn USD, based on our calculations. The ETC Group MSCI Digital Assets Select 20 ETP (DA20) did experience neither in- nor outflows last week (+/- 0 mn USD).
Besides, the beta of global crypto hedge funds to Bitcoin over the last 20 trading rebounded sharply to around 0.97. This implies that global crypto hedge funds have significantly increased their market exposure and have currently a neutral exposure to Bitcoin.
On-Chain Data
Bitcoin’s on-chain data have continued to improve over the past week.
Short-term holders of bitcoin generally took losses as we declined below their costs basis at round 58k USD. So, there was a capitulation by short-term investors as the short-term holder spent output profit ratio (STH SOPR) reached the lowest level since March 2023. This tends to be a reliable signal for a short-term tactical bottom and also coincided with a generally very bearish sentiment.
Moreover, the increase in accumulation activity in Bitcoin that we had already observed the week prior has continued last week as well which put a floor below prices. What is more is that accumulation activity has even broadened to include larger wallet cohorts. Both very small and very large wallet cohorts currently seem to increase their wallet balances again judging by our own “average accumulation score”.
The average accumulation score aggregates individual accumulation scores across different wallet cohorts and shows the average balance growth across these different wallet cohorts.
The fact that larger wallet cohorts have started increasing their accumulation activity is also supported by the fact that wallets in excess of 100 BTC have significantly increased their purchases in the short term.
This is also corroborated by the fact that BTC whale net exchange flows have turned negative again over the past week with more outbound than inbound whale transfers from/to exchanges.
That being said, active addresses remain relatively weak and have declined towards year-to-date lows again. However, our own measure of overall Bitcoin network activity which includes active addresses, transaction count, UTXO count and block size remains near all-time highs.
Besides, Bitcoin’s hash rate still remains near all-time highs as miners still remain relatively unaffected by the recent halving of the block subsidy. BTC miners transfers to exchanges remain very low and overall miner balances are currently still moving sideways implying no significant selling by miners.
Overall, capitulation by short-term holders as well as broadening accumulation activity are a positive signal.
Futures, Options & Perpetuals
Last week, futures open interest continued to move sideways in BTC-terms and perpetual BTC futures only experienced a slight increase in open interest.
Despite the most recent price correction last week there were no significant futures long liquidations either. That being said, the BTC perpetual funding rate turned negative last week on Thursday and Friday which indicates oversold positioning and which tends to be a reliable signal for a short-term tactical bottom as well.
The Bitcoin futures basis mostly went sideways last week. It declined to new cycle lows during the latest price correction before reversing to around 9.3% p.a. again.
Bitcoin options’ open interest increased only slightly last week as BTC option traders seem to have increased their exposure to puts relative to calls. This was also evident in a short-term spike in relative put volumes.
Consistent with this observation, the 25-delta BTC 1-month option skew increased to levels last seen in January during the volatile US spot Bitcoin ETF trading launch.
Despite the dip to new lows in price, BTC option implied volatilities have only increased slightly. Implied volatilities of 1-month ATM Bitcoin options are currently at around 56.4% p.a., up from 54% p.a. the week prior.
Bottom Line
• Bitcoin reverses sharply from oversold levels following the dovish FOMC meeting last week
• Our in-house “Cryptoasset Sentiment Indicator” has rebounded sharply from very bearish levels and currently signals neutral sentiment again
• Crypto hedge fund’s beta implies that crypto hedge funds have significantly increased their market exposure to Bitcoin from underweight to neutral levels over the past week
To read our Crypto Market Compass in full, please click the button below

This is not investment advice. Capital at risk. Read the full disclaimer


Crypto Market Compass 6 May 2024

EDM6 ETF investerar i europeiska aktier med fokus på ESG

J.P. Morgans första rapport om globala familjekontor: Trender och utmaningar

XEAL ETC spårar priset på koldioxidkrediter

Några av de bästa guldfonderna

ETFmarknaden i Europa firar sitt 24-årsjubileum med tillgångar på två biljoner USD

Tillgång till obligationsmarknaden för företagsobligationer från utvecklade marknader

Vilken är den bästa fond som följer Nasdaq-100?

De mest populära börshandlade fonderna april 2024

Försvarsfond når förvaltad volym på 500 MUSD
-
 Nyheter3 veckor sedan
ETFmarknaden i Europa firar sitt 24-årsjubileum med tillgångar på två biljoner USD
-
 Nyheter3 veckor sedan
Tillgång till obligationsmarknaden för företagsobligationer från utvecklade marknader
-
 Nyheter1 vecka sedan
Vilken är den bästa fond som följer Nasdaq-100?
-
 Nyheter1 vecka sedan
De mest populära börshandlade fonderna april 2024
-
 Nyheter4 veckor sedan
Försvarsfond når förvaltad volym på 500 MUSD
-
 Nyheter3 dagar sedan
Några av de bästa guldfonderna
-

 Nyheter2 veckor sedan
U.S. Global Investors tar över HANetf Travel
-

 Nyheter3 veckor sedan
Bygg din egen pengamaskin