
Nyheter
CAD heading lower

Trade Idea – Foreign Exchange – CAD heading lower
Highlights
- The CAD has decoupled from oil prices as economic prospects wane.
- Bank of Canada (BoC) has indicated that further stimulus was considered at the latest monetary policy meeting.
- Weaker oil prices should see short positions mount against the CAD and the USD/CAD climb higher.
Oil prices offer little support
Since OPEC took the surprise decision to limit production last month crude benchmarks have managed to settle in a new trading range in and around the psychologically important $50/bbl level. Typically, this move would have lent support to the Canadian Dollar (CAD) against its major currency counterparts (due to its status as a commodity currency) but on this occasion it has failed to do so (see Figure 1). Instead, the currency has suffered from a widening nominal yield differential with the US (see Figure 1) and meagre economic prospects. This has helped to keep the USD/CAD moving on a well-established upward path for some time and the trend appears well placed to continue. We see a high likelihood of upcoming oil price weakness and an increasingly dovish bias from the Bank of Canada (BoC) helping to push the pair higher in the next few months.
(click to enlarge)
Crude fragility and dovish inclinations
Earlier this week, comments from the Iraqi oil minister claiming that the embattled nation should be exempt from any OPEC production agreement highlighted the challenges the cartel faces in imposing any limits. Several of its members are facing significant financial and geopolitical pressures (Iraq, Venezuela, Saudi Arabia etc.) and so applying country level quotas is almost certain to face obstacles. Until now the market has perceived the deal optimistically but the difficult practicalities of implementing the agreement are likely to see oil prices retrace a portion of their recent gains. This will likely add to bearish sentiment against the CAD and may prompt a monetary reaction from the BoC.
Recent comments and actions from the BoC have been mixed. At the latest meeting the central bank held interest rates steady (as broadly expected) and described risks to the inflation outlook as “roughly balanced”, a positive shift from “tilted to the downside” in the previous meeting. However in a surprising turn, the BoC governor, Stephen Poloz, did mention that the governing council “actively discussed the possibility of adding more stimulus”. In addition, the BoC reduced both its inflation and growth forecasts for this year and the next. While these actions failed to inspire a market repricing of future interest cuts, it does show a return to a dovish bias which may grow if manufacturing, trade and inflation data continue to disappoint.

(click to enlarge)
Shorts could mount
Net speculative positioning towards the CAD fell into negative territory at the end of last month, but still remains moderate. The move resulted from a reduction in long positions rather than a build-up in shorts, which remain a fraction of January levels due to recent strength in oil prices (see Figure 2). Any weakness in oil could see shorts build up and send the USD/CAD to higher levels. The pair is on a strong upward path and is only likely to face resistance at the 1.356 level, which is near March highs and would represent a 50% retracement of its decline earlier in the year.
Investors wishing to express the investment views outlined above may consider using the following ETF Securities ETPs:
Currency ETPs
EUR Base
ETFS Long CAD Short EUR (ECAD)
ETFS Short CAD Long EUR (CADE)
GBP Base
ETFS Long CAD Short GBP (GBCA)
ETFS Short CAD Long GBP (CAGB)
USD Base
ETFS Long CAD Short USD (LCAD)
ETFS Short CAD Long USD (SCAD)
3x
ETFS 3x Long CAD Short EUR (ECA3)
ETFS 3x Short CAD Long EUR (CAE3)
5x
ETFS 5x Long CAD Short EUR (ECA5)
ETFS 5x Short CAD Long EUR (CAE5)
Currency Baskets
ETFS Bullish USD vs Commodity Currency Basket Securities (SCOM)
ETFS Bearish USD vs Commodity Currency Basket Securities (LCOM)
Important Information
This communication has been provided by ETF Securities (UK) Limited (“ETFS UK”) which is authorised and regulated by the United Kingdom Financial Conduct Authority (the “FCA”). The products discussed in this document are issued by ETFS Foreign Exchange Limited (“FXL”). FXL is regulated by the Jersey Financial Services Commission.
This communication is only targeted at professional investors. In Switzerland, this communication is only targeted at Regulated Qualified Investors.


India’s vibrant economy and structural growth opportunities continue to be the envy of many emerging markets. But somewhat unique to this market are tax implications that investors should be aware of. Our Franklin Templeton Global ETF team examines these structural issues in Asia’s third-largest economy.
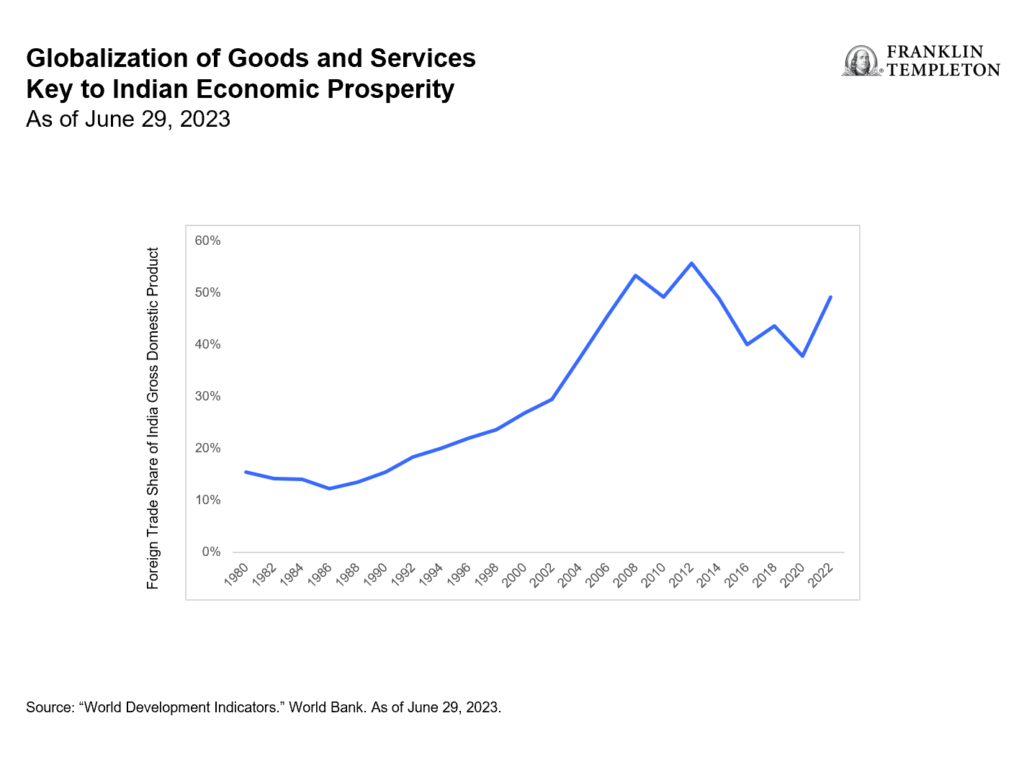
In merely a decade, India has taken a quantum leap from the world’s 11th largest economy to become its fifth largest. By many accounts, it is expected to remain one of the world’s fastest-growing major economies over the coming years. And even after a banner 2023 during which the country’s benchmark indexes surged and Indian Prime Minister Narendra Modi celebrated high-profile successes—from historic technological and space exploration achievements to rising global diplomatic clout—this election year has already marked more progress in supporting Modi’s pro-growth, pro-jobs efforts.
The world’s most populous nation has advanced ties with Western countries over free trade. In addition to agreements with Australia and the United Arab Emirates, it has worked to better integrate the “Global South’s” development needs and ambitions with that of the G20. Modi has touted innovative partnerships for a new multilateral rail and sea corridor to connect India with the Middle East and the European Union (EU)—seen as a counterweight to China’s vast Belt-and-Road infrastructure corridor.
India reached its latest notable trade pact, nearly 16 years in the making, in March with the European Free Trade Association—Iceland, Liechtenstein, Norway and Switzerland. The agreement lifts Indian tariffs to secure US$100 billion in foreign direct investment commitments from the non-EU markets to India across multiple sectors.
With India still an enviable investment powerhouse, it seems important to clarify a few aspects of this dynamic equity market.
How exchange-traded funds (ETFs) treat India capital gains tax (CGT)
Foreign investors should be aware that CGT is an integral part of investing in Indian equities that cannot be circumvented. Investors in India funds are subject to CGT implications regardless of fund provider, and CGT is based and calculated on a fund as a whole, not an individual investor’s position.
The details: Foreign investors owning local Indian stocks are subject to taxation on capital gains at a short-term rate of 15% for positions held for less than one year and at a long-term rate of 10% for positions held over one year.
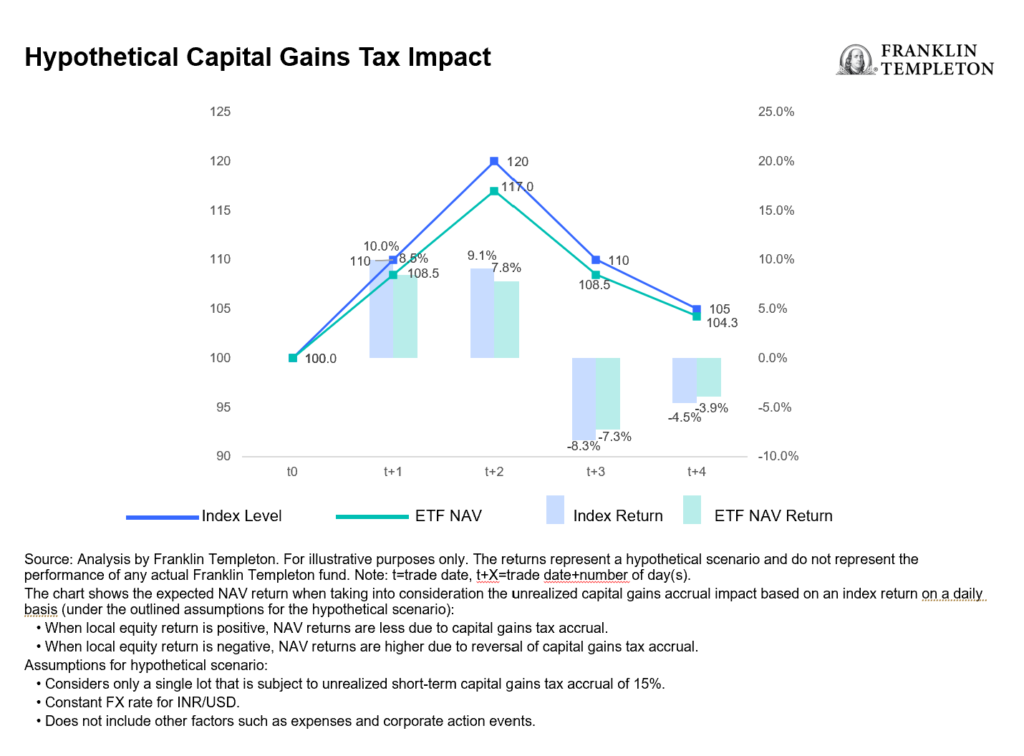
To accrue or not to accrue: Consistent with market practice for US-listed India ETF providers, Franklin Templeton accrues unrealized CGT in its daily net asset value (NAV). This can lead to differences in performance relative to the benchmark, which does not include CGT. As a result, rising markets will typically lead to fund underperformance against a benchmark, while weaker market environments will typically generate outperformance (provided the fund is in an unrealized capital gain position where the current market value of fund holdings is above their historical book cost). See chart below.
For UCITS-listed India funds, there is a divergence in methods utilized by fund providers in accruing and reporting CGT. Some do not accrue unrealized CGT in the NAV, but will charge CGT to investors directly at redemption, which we believe leaves investors with a level of opaqueness and uncertainty over their ultimate proceeds. This method also creates an elevated NAV compared to what investors will actually experience. While Franklin Templeton’s approach to CGT may at times lead to a higher tracking difference,1 we believe investors benefit from increased transparency and a more reflective experience.
The magnitude and impact of CGT for a specific fund is heavily dependent on several variables, such as the timing of purchases and sales, performance of the holdings and their volatility, and the size of flows in and out of the fund relative to its assets under management (AUM).
Understanding the impact: The CGT impact to fund performance is driven by the path of returns, timing of individual lots and price points. Very broadly speaking, in rising markets, an NAV-accruing fund will likely underperform its benchmark and vice versa.
Consideration of comparability: Because different providers handle CGT differently, the comparability of fund performance metrics may be affected. As investors, it’s prudent to consider how these nuances may influence investment decisions within the broader context of your financial strategy.
The bigger picture: While CGT considerations are important, they should be viewed within the broader spectrum of investment objectives and risk tolerance. Taking a long-term perspective and being mindful of other important characteristics of the investment vehicle of choice may aid in the decision-making process.
In summary, India remains an attractive investment destination with compelling growth prospects for its equity markets. Investors seeking India allocation through an ETF should be aware of the current tax regime and what varying methods of accounting methodologies really mean for fund valuation.


Vilken är den bästa fond som följer Nasdaq-100?

Inevitable in India: Crowds, cricket and capital gains tax

XB33 ETF köper företagsobligationer i euro som förfaller 2033

Ny ETF från Franklin Templeton investerar med katolska värderingar

Playing the AI revolution through commodities and gold’s curious rally

ETFmarknaden i Europa firar sitt 24-årsjubileum med tillgångar på två biljoner USD

De mest populära börshandlade fonderna mars 2024

Tillgång till obligationsmarknaden för företagsobligationer från utvecklade marknader

FUIG ETF investerar i hållbara företagsobligationer som följer Parisavtalet

Försvarsfond når förvaltad volym på 500 MUSD
-
 Nyheter2 veckor sedan
ETFmarknaden i Europa firar sitt 24-årsjubileum med tillgångar på två biljoner USD
-
 Nyheter4 veckor sedan
De mest populära börshandlade fonderna mars 2024
-
 Nyheter2 veckor sedan
Tillgång till obligationsmarknaden för företagsobligationer från utvecklade marknader
-
 Nyheter4 veckor sedan
FUIG ETF investerar i hållbara företagsobligationer som följer Parisavtalet
-
 Nyheter2 veckor sedan
Försvarsfond når förvaltad volym på 500 MUSD
-

 Nyheter4 veckor sedan
Vad händer härnäst för Bitcoin?
-

 Nyheter3 veckor sedan
Ny börshandlad fond från Deka ger tillgång till S&P 500-index
-

 Nyheter4 veckor sedan
Investera i guldgruvor med ETFer