
Nyheter
Eurozone Deal Remains Elusive

ETFS Multi-Asset Weekly Eurozone Deal Remains Elusive
Coffee rebounds following Brazilian Real appreciation.
Chinese stocks cheer signs of further stimulus.
Sterling comes under pressure on inflation concerns.

Today Angela Merkel will host talks with Alex Tsipras, the Greek premier, in a bid to improve relations between the two nations and ensure the future of Greece within the Eurozone. The meeting comes as recent negotiations over the conditions of a Greek bailout package have divided public opinion and strained political ties. Elsewhere, the release of a series of manufacturing and home sales data this week will give investors the opportunity to gauge the health of major global economies. CPI data from the US and the UK will give clarity on the impact of low energy and food prices on inflation and the potential pace of rate hikes.
Commodities
Coffee rebounds following Brazilian Real appreciation. Coffee prices have come under significant pressure this year, falling 24% to US$1.26 per pound last week. This downward trend has been driven by healthy rainfall and a significant depreciation of the Brazilian Real. A weaker Real allows Brazilian producers to export coffee internationally at lower prices in US Dollar terms, without receiving less in their domestic currency. Last week the return of drier weather conditions and a temporary appreciation of the Real on Tuesday caused a reversal of the recent trend with coffee ending the week up 8.7%. US crude fell to a six-year low last week as stockpiles continued to accumulate and shale production showed little to no signs of slowing. US shale producers have shifted focus to rig efficiency and cost reduction to maintain output at current levels. Later in the year the curtailment of exploration spending and fall in the rig count should act to moderate US crude oil production and lift prices.
Equities
Chinese stocks cheer signs of further stimulus. On Sunday, the Chinese premier Li Keqiang pledged to shore up the economy to ensure that it meets its 7% growth target. Chinese equity markets rallied in approval, taking the statement as an indication that further stimulus measures are on their way in the form of reserve requirement reductions and interest rate cuts. The MSCI China A Index ended the week up 7.4% at an all-time high on the news. The FTSE 100 rose 3.0% in the week following the UK Chancellor of the Exchequers announcement of the 2015 pre-election budget. The budget sent energy and real estate stocks higher as the Chancellor announced measures to reduce tax on North Sea oil & gas companies and assist first time homebuyers. The EURO STOXX 50® Investable Volatility Index increased 3.6% as tensions mounted between Greece and Germany over reforms necessary in order to secure bailout funds.
Currencies
Sterling comes under pressure on inflation concerns. Following the Federal Open Market Committee meeting last week, a cautious press statement caused the Sterling to rise by 1.5% against the Dollar, the largest daily increase in five and a half years. These gains proved temporary as the Dollar recouped the prior day losses against most major currencies. Furthermore, minutes from the latest BOE meeting highlighted that consumer inflation will likely fall below zero soon and could potentially stay there if energy and food prices keep inflationary pressures at bay. Sterling is likely to continue to experience volatility in coming months, as the lack of a clear favorite in the upcoming general election and the growing popularity of parties on the fringe could lead investors to question the conviction of the British government.
Important Information
This communication has been issued and approved for the purpose of section 21 of the Financial Services and Markets Act 2000 by ETF Securities (UK) Limited (”ETFS UK”) which is authorised and regulated by the United Kingdom Financial Conduct Authority (”FCA”).


India’s vibrant economy and structural growth opportunities continue to be the envy of many emerging markets. But somewhat unique to this market are tax implications that investors should be aware of. Our Franklin Templeton Global ETF team examines these structural issues in Asia’s third-largest economy.
In merely a decade, India has taken a quantum leap from the world’s 11th largest economy to become its fifth largest. By many accounts, it is expected to remain one of the world’s fastest-growing major economies over the coming years. And even after a banner 2023 during which the country’s benchmark indexes surged and Indian Prime Minister Narendra Modi celebrated high-profile successes—from historic technological and space exploration achievements to rising global diplomatic clout—this election year has already marked more progress in supporting Modi’s pro-growth, pro-jobs efforts.
The world’s most populous nation has advanced ties with Western countries over free trade. In addition to agreements with Australia and the United Arab Emirates, it has worked to better integrate the “Global South’s” development needs and ambitions with that of the G20. Modi has touted innovative partnerships for a new multilateral rail and sea corridor to connect India with the Middle East and the European Union (EU)—seen as a counterweight to China’s vast Belt-and-Road infrastructure corridor.
India reached its latest notable trade pact, nearly 16 years in the making, in March with the European Free Trade Association—Iceland, Liechtenstein, Norway and Switzerland. The agreement lifts Indian tariffs to secure US$100 billion in foreign direct investment commitments from the non-EU markets to India across multiple sectors.
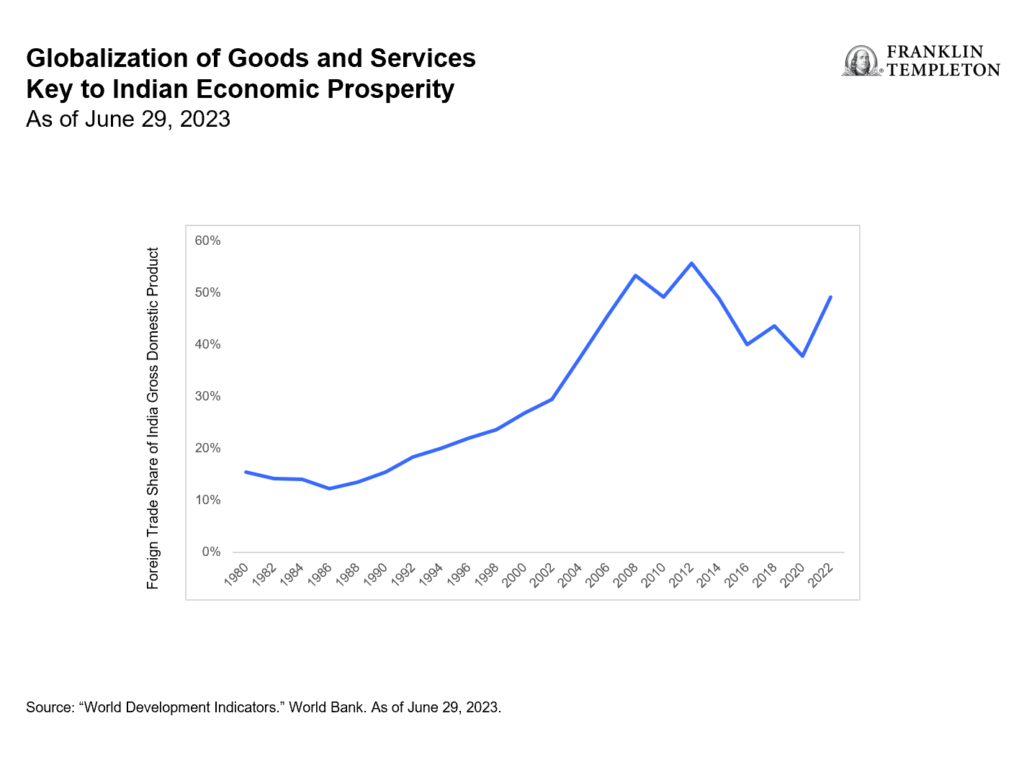
With India still an enviable investment powerhouse, it seems important to clarify a few aspects of this dynamic equity market.
How exchange-traded funds (ETFs) treat India capital gains tax (CGT)
Foreign investors should be aware that CGT is an integral part of investing in Indian equities that cannot be circumvented. Investors in India funds are subject to CGT implications regardless of fund provider, and CGT is based and calculated on a fund as a whole, not an individual investor’s position.
The details: Foreign investors owning local Indian stocks are subject to taxation on capital gains at a short-term rate of 15% for positions held for less than one year and at a long-term rate of 10% for positions held over one year.
To accrue or not to accrue: Consistent with market practice for US-listed India ETF providers, Franklin Templeton accrues unrealized CGT in its daily net asset value (NAV). This can lead to differences in performance relative to the benchmark, which does not include CGT. As a result, rising markets will typically lead to fund underperformance against a benchmark, while weaker market environments will typically generate outperformance (provided the fund is in an unrealized capital gain position where the current market value of fund holdings is above their historical book cost). See chart below.
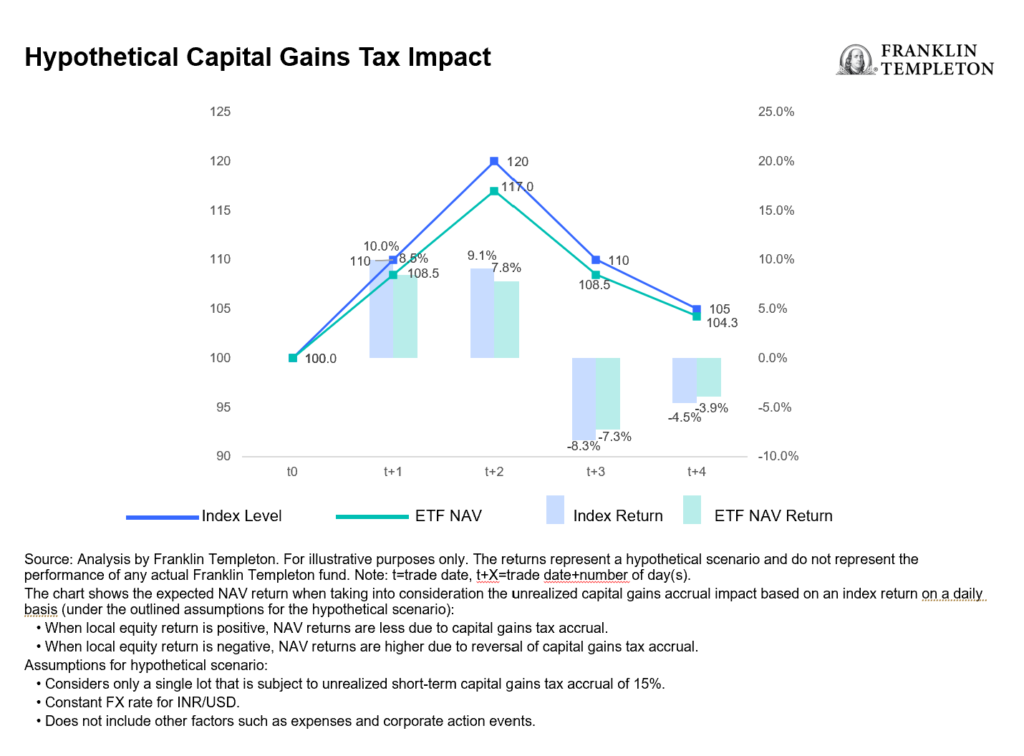
For UCITS-listed India funds, there is a divergence in methods utilized by fund providers in accruing and reporting CGT. Some do not accrue unrealized CGT in the NAV, but will charge CGT to investors directly at redemption, which we believe leaves investors with a level of opaqueness and uncertainty over their ultimate proceeds. This method also creates an elevated NAV compared to what investors will actually experience. While Franklin Templeton’s approach to CGT may at times lead to a higher tracking difference,1 we believe investors benefit from increased transparency and a more reflective experience.
The magnitude and impact of CGT for a specific fund is heavily dependent on several variables, such as the timing of purchases and sales, performance of the holdings and their volatility, and the size of flows in and out of the fund relative to its assets under management (AUM).
Understanding the impact: The CGT impact to fund performance is driven by the path of returns, timing of individual lots and price points. Very broadly speaking, in rising markets, an NAV-accruing fund will likely underperform its benchmark and vice versa.
Consideration of comparability: Because different providers handle CGT differently, the comparability of fund performance metrics may be affected. As investors, it’s prudent to consider how these nuances may influence investment decisions within the broader context of your financial strategy.
The bigger picture: While CGT considerations are important, they should be viewed within the broader spectrum of investment objectives and risk tolerance. Taking a long-term perspective and being mindful of other important characteristics of the investment vehicle of choice may aid in the decision-making process.
In summary, India remains an attractive investment destination with compelling growth prospects for its equity markets. Investors seeking India allocation through an ETF should be aware of the current tax regime and what varying methods of accounting methodologies really mean for fund valuation.


INQQ ETF ger exponering mot Internet och e-commerce i Indien

Vilken är den bästa fond som följer Nasdaq-100?

Inevitable in India: Crowds, cricket and capital gains tax

XB33 ETF köper företagsobligationer i euro som förfaller 2033

Ny ETF från Franklin Templeton investerar med katolska värderingar

ETFmarknaden i Europa firar sitt 24-årsjubileum med tillgångar på två biljoner USD

De mest populära börshandlade fonderna mars 2024

Tillgång till obligationsmarknaden för företagsobligationer från utvecklade marknader

FUIG ETF investerar i hållbara företagsobligationer som följer Parisavtalet

Försvarsfond når förvaltad volym på 500 MUSD
-
 Nyheter2 veckor sedan
ETFmarknaden i Europa firar sitt 24-årsjubileum med tillgångar på två biljoner USD
-
 Nyheter4 veckor sedan
De mest populära börshandlade fonderna mars 2024
-
 Nyheter2 veckor sedan
Tillgång till obligationsmarknaden för företagsobligationer från utvecklade marknader
-
 Nyheter4 veckor sedan
FUIG ETF investerar i hållbara företagsobligationer som följer Parisavtalet
-
 Nyheter2 veckor sedan
Försvarsfond når förvaltad volym på 500 MUSD
-
 Nyheter23 timmar sedan
Vilken är den bästa fond som följer Nasdaq-100?
-

 Nyheter4 veckor sedan
Vad händer härnäst för Bitcoin?
-

 Nyheter3 veckor sedan
Ny börshandlad fond från Deka ger tillgång till S&P 500-index