Nyheter
Gold Reacts Positively on Market Events in China
Publicerad
9 år sedanden

Gold Reacts Positively on Market Events in China Van Eck Global’s gold specialist Joe Foster shares his monthly perspective on the gold market.
» Open Gold Market Commentary
Gold Reacts Positively on Market Events in China
By: Joe Foster, Gold Strategist
Please note that the information herein represents the opinion of the author and these opinions may change at any time and from time to time.
Market Review
Gold reacted favorably to the panic that afflicted global financial markets in August. Events unfolding in China brought weakness and volatility to markets around the world. Gold started trending higher on August 11 when the Chinese government made adjustments to the way the yuan is currently managed, enabling the currency to experience its largest two-day decline in more than a decade. Some analysts saw this as a desperate attempt by China to help stimulate its ailing economy through currency devaluation. With confidence waning, on August 18 China’s stock markets began a plunge to new lows for the year, with the Shanghai CSI 100 Index2 declining 24% in six trading days. This reverberated through global markets as commodities, emerging market currencies, and many developed market stock indices declined to new lows.
While the gold market encountered considerable volatility, gold bullion outperformed most asset classes in August with a $38.98 (3.6%) gain, compared to declines of 1.5% for copper, 1.3% for the U.S. Dollar Index (DXY)3, and 6.0% for the S&P 500 Index.4 Gold stocks felt the pressure of the general stock market selloff, however, they were still able to achieve gains for the month, as shown by the 2.06% advance in the NYSE Arca Gold Miners Index and the 4.66% gain in the Market Vectors Junior Gold Miners Index.5
Several indicators suggested tight supplies of physical gold in August. After experiencing heavy redemptions in July, gold bullion exchange-traded products became buyers, Shanghai Gold Exchange premiums trended higher, and gold forward lease rates turned negative. Offsetting these bullish indicators were reports of hedging by gold producers in Australia. With the Australian dollar gold price up 9.8% this year, some producers are seeing an opportunity to use limited hedging (selling gold forward) to ensure cash flows to high cost operations or to service debt.
Market Outlook
In August, gold performed as a safe haven investment, evidenced by its outperformance against most asset classes in the midst of widespread panic. Investors were afraid that further economic weakness in China might spread to engulf the global economy. Since 2013 gold has experienced several short-covering rallies sparked by geopolitical or financial stress. The last took place in January, when Greek debt problems reemerged and the Swiss broke its currency’s peg to the euro. These rallies had no legs because, in our opinion, the risks that drove them posed no real or lasting threat to the global economy, particularly the U.S. economy or financial system. Now financial risk is again driving gold and we ask, is this another temporary short-covering rally or the beginning of a sustainable trend? Once the short covering has run its course, is there enough investment demand to drive gold?
While the weak Chinese economy certainly bears watching, we believe international markets are overreacting. China has been working with the International Monetary Fund (IMF) and others to enable the yuan to achieve international currency reserve status. The IMF is expected to make a decision, which may come later in 2016, on whether to include the yuan in its currency basket. The recent disclosure of China’s gold reserves and moves to eventually enable the yuan to float freely are part of this process. It looks as though the Chinese government is learning the hard way that changing currency policy in the midst of a stock market rout is not the best timing.
The meteoric rise of the Chinese stock market this year was driven mainly by a change in margin rules that enabled retail investors to speculate. With the market crash, the Chinese government is again learning the hard way what happens when inexperienced investors are given access to loans used to speculate on the market.
While these events are important to China, their fundamental impact on the global economy and financial system dissipates as one moves further from Asia. The Asian crisis of 1997 – 1998 was much worse, eventually triggering a Russian debt default and the implosion of hedge fund management firm, Long Term Capital Management. Yet the U.S. economy survived unscathed and gold’s overall trend was down from 1996 to 1999. Similarly, we don’t believe current events in China can serve as the source of longer-term support for gold as a safe-haven investment in the West.
Rather than focus on China, we see far greater risk elsewhere. The markets are quite nervous, which is not a good backdrop at a time when the Federal Reserve (Fed) is poised to make a historic rate decision. With policy rates near zero, the Fed’s primary tool (rate cuts) to kick start the economy is useless, in our view. This probably accounts for much of the nervousness, as investors must decide whether a shock in Asia can generate a market tsunami that reaches U.S. shores with virtually no policy protection.
Now the rest of the world must wonder whether the Fed will set off a ripple effect with a rate increase that turns into a tsunami on distant shores. The U.S. economy is relatively healthy and could probably withstand a series of rate increases. However, the Japanese economy contracted by 1.6% in the second quarter.6
China’s struggles are widely known. Brazil is in recession. European growth is slow and consumer prices advanced just 0.2% (annualized) in August.7 The price of WTI crude oil fell below $40 per barrel in August and copper is nearing $2.00 per pound. The flow of easy money brought on by quantitative easing8 and the carry trade into emerging markets reversed course when the Fed began to taper a couple of years ago. The world outside of the U.S. is now on the verge of deflation. Will rising rates, a strong U.S. dollar, and economic opportunities in the U.S. suck the remaining economic life (growth capital) out of the global economy? Can the U.S. remain an island of prosperity?
An important difference between now and the period of the 1997 Asian crisis are the imbalances in the global financial system caused by radical monetary and fiscal policies. Imbalances in interest rates, sovereign debt, asset prices, and central bank holdings are currently at unprecedented levels. Raising rates in a weak global economy with macro imbalances has risks. Postponing or eventually reversing course would damage the Fed’s credibility and would risk a loss of confidence. As we move towards 2016, these are some of the issues that could be supportive of the gold market. The more probable source of systemic risk lies in Washington, D.C., not Beijing.
Important Information For Foreign Investors
This document does not constitute an offering or invitation to invest or acquire financial instruments. The use of this material is for general information purposes.
Please note that Van Eck Securities Corporation offers actively managed and passively managed investment products that invest in the asset class(es) included in this material. Gold investments can be significantly affected by international economic, monetary and political developments. Gold equities may decline in value due to developments specific to the gold industry, and are subject to interest rate risk and market risk. Investments in foreign securities involve risks related to adverse political and economic developments unique to a country or a region, currency fluctuations or controls, and the possibility of arbitrary action by foreign governments, including the takeover of property without adequate compensation or imposition of prohibitive taxation.
Please note that Joe Foster is the Portfolio Manager of an actively managed gold strategy.
Any indices listed are unmanaged indices and include the reinvestment of all dividends, but do not reflect the payment of transaction costs, advisory fees or expenses that are associated with an investment in the Fund. An index’s performance is not illustrative of the Fund’s performance. Indices are not securities in which investments can be made.
NYSE Arca Gold Miners Index (GDMNTR) is a modified market capitalization-weighted index comprised of publicly traded companies involved primarily in the mining for gold. 2CSI 100 consists of the largest 100 stocks in CSI 300. CSI 100 aims to comprehensively reflect the price fluctuation and performance of the large and influential companies in Shanghai and Shenzhen securities market. 3U.S. Dollar Index (DXY) indicates the general international value of the U.S. dollar. The DXY does this by averaging the exchange rates between the U.S. dollar and six major world currencies: Euro, Japanese yen, Pound sterling, Canadian dollar, Swedish kroner, and Swiss franc. 4S&P 500® Index (S&P 500) consists of 500 widely held common stocks covering industrial, utility, financial, and transportation sectors. 5Market Vectors Junior Gold Miners Index (MVGDXJTR) is a rules-based, modified market capitalization-weighted, float-adjusted index comprised of a global universe of publicly traded small- and medium-capitalization companies that generate at least 50% of their revenues from gold and/or silver mining, hold real property that has the potential to produce at least 50% of the company’s revenue from gold or silver mining when developed, or primarily invest in gold or silver. 6Cabinet Office Data Release, August 18, 2015. 7Eurostat data, August 2015. 8Quantitative easing (QE) is an unconventional monetary policy used by a central bank to stimulate an economy when standard monetary policy has become ineffective.
Please note that the information herein represents the opinion of the author and these opinions may change at any time and from time to time. Not intended to be a forecast of future events, a guarantee of future results or investment advice. Historical performance is not indicative of future results; current data may differ from data quoted. Current market conditions may not continue. Non-Van Eck Global proprietary information contained herein has been obtained from sources believed to be reliable, but not guaranteed. No part of this material may be reproduced in any form, or referred to in any other publication, without express written permission of Van Eck Global. ©2015 Van Eck Global.
Du kanske gillar
Nyheter
Valour lanserar Internet Computer (ICP) och Toncoin (TON) ETP i Norden
Publicerad
2 timmar sedanden
13 maj, 2024
Valour lanserar tre banbrytande börshandlade produkter (“ETPs”) inklusive Valour Internet Computer (ICP) ETP, Valour Toncoin (TON) ETP och Valour Chainlink (LINK) ETP, som markerar betydande milstolpar i det nordiska investeringslandskapet.
- Nordens första i sitt slag: Valour Internet Computer (ICP) ETP och Valour Toncoin (TON) ETP är de första erbjudandena i sitt slag i Norden, som ger investerare oöverträffad tillgång till innovativa ekosystem.
- Förenklad tillgång till banbrytande tillgångar: Handel med alla tre ETPer påbörjades den 10 maj 2024, med en förvaltningsavgift på 1,9 %. Dessa ETPer möjliggör sömlös tillgång till banbrytande digitala tillgångar, och erbjuder investerare förenklade möjligheter att engagera sig i den transformativa potentialen hos ICP, TON och LINK.
- Toncoin (TON) Analystäckning: DeFi Technologies dotterbolag, Reflexivity Research, ett ledande forskningsföretag som specialiserat sig på att skapa högkvalitativa, djupgående forskningsrapporter för bitcoin- och kryptovalutaindustrin för att ge investerare värdefulla insikter, har initierat analystäckning om TON.
Valour som ger förenklad tillgång till digitala tillgångar, har lanserat tre ETPer. Bland dessa erbjudanden finns Valour Internet Computer (ICP) ETP och Valour Toncoin (TON) ETP, den första i sitt slag i Norden. Dessa åtföljs av Valour Chainlink (LINK) ETP, som ger förenklad tillgång till avancerade digitala tillgångar.
Handeln med alla tre ETPerna inleddes den 10 maj 2024, med en förvaltningsavgift på 1,9 %.
Valour Internet Computer (ICP) ETP
Valour Internet Computer (ICP) SEK ETP (ISIN: CH1213604510) erbjuder investerare oöverträffad tillgång till framtiden för webbutveckling genom att spåra priset på ICP, den infödda token som driver Internetdatorns ekosystem. Med sitt unika fokus på enkelhet och säkerhet kan investerare sömlöst engagera sig med ICP genom sina traditionella bank- eller mäklarkonton. ICP har ett börsvärde på 5,5 miljarder dollar och rankas tjugofjärde bland alla kryptovalutor globalt.
Internetdatorprojektet banar väg för en ny era av webbutveckling genom att skapa en decentraliserad och skalbar internetinfrastruktur. Genom att göra det möjligt för smarta kontrakt att köras direkt på sitt nätverk, eliminerar Internetdatorn behovet av traditionella serverbaserade arkitekturer, vilket inleder ett paradigmskifte inom webbutveckling. Detta innovativa tillvägagångssätt säkerställer större säkerhet, effektivitet och tillgänglighet för både utvecklare och användare.
Valour Toncoin (TON) ETP
Valour Toncoin (TON) SEK ETP (ISIN: CH1161139600) gör det möjligt för investerare att få tillgång till Toncoin, TONs infödda token, sömlöst och säkert via deras traditionella bank- eller mäklarkonto. Toncoin, med sitt fokus på snabba transaktionshastigheter och låga avgifter, ger en effektiv lösning för både inhemska och internationella betalningar, vilket gör det till ett attraktivt alternativ för olika finansiella tillämpningar. TON har ett börsvärde på $23,25 miljarder och rankas som nionde bland alla kryptovalutor globalt.
Toncoin, den infödda symbolen för TON, erbjuder ett robust och effektivt sätt att utbyta värde, som syftar till att effektivisera betalningsprocesser över olika finansiella landskap. Med sin betoning på snabba transaktionshastigheter och minimala transaktionsavgifter står Toncoin som en lovande lösning för både individer och företag som söker sömlösa betalningsupplevelser.
Företaget är också glada att meddela att dess dotterbolag, Reflexivity Research, ett ledande forskningsföretag som specialiserat sig på att skapa högkvalitativa, djupgående forskningsrapporter för bitcoin- och kryptovalutaindustrin för att ge investerare värdefulla insikter, har initierat forskningstäckning om TON. Rapporten finns här.
Valour Chainlink (LINK) ETP
Valour Chainlink (LINK) SEK (ISIN: CH1161139592) ETP kommer att göra det möjligt för investerare att få exponering mot LINK, enkelt och säkert, via sin bank eller mäklare. LINK har ett börsvärde på 13,63 miljarder dollar och rankas som artonde bland alla kryptovalutor globalt.
Chainlink, känt som ett decentraliserat orakelnätverk, spelar en avgörande roll för att möjliggöra smarta kontrakt på blockchain-plattformar för att säkert interagera med verklig data. Genom att fungera som en brygga mellan blockchain-baserade smarta kontrakt och externa datakällor, underlättar Chainlink genomförandet av förtroendefria och manipuleringssäkra avtal. Dess decentraliserade karaktär säkerställer tillförlitligheten och integriteten hos data, vilket förbättrar effektiviteten och säkerheten för blockchain-transaktioner.
”Valour förblir orubbligt i vårt åtagande att erbjuda investerare ett brett utbud av investeringsmöjligheter för digitala tillgångar”, säger Olivier Roussy Newton, VD för DeFi Technologies. ”Inkluderingen av dessa banbrytande ETPer i vår produktlinje understryker vårt engagemang för att leverera innovativa lösningar som uppfyller de växande behoven hos investerare i det digitala tillgångsområdet Vi är glada över att få täckning från vårt nyligen förvärvade dotterbolag, Reflexivity Research, för att sammanfalla med produktlanseringarna, vilket ger investerare värdefulla insikter och förbättrar deras förståelse för marknadslandskapet.
”Våra unika ETP-erbjudanden i Norden befäster vår ledande position som emittenten med det bredaste utbudet av produkter”, säger Johanna Belitz, Valours försäljningschef, Norden. ”När efterfrågan på altcoins ökar, förväntar vi oss ivrigt mottagandet av våra tre nya erbjudanden i regionen.”
Valour fortsätter att leda ansvaret för att driva innovation inom det digitala tillgångsområdet och utöka sitt produktutbud för att tillgodose de växande behoven hos investerare i Norden. Utöver Valour Toncoin (TON), Internet Computer (ICP) och Chainlink (LINK) ETPerna planerar Valour att introducera ett brett utbud av digitala tillgångsinvesteringsprodukter under de kommande månaderna, vilket ytterligare förbättrar tillgängligheten och bekvämligheten för traditionella investerare.
Handla Valours produkter
Valours produkter är europeiska börshandlade produkter som handlas på bland annat Nordic Growth Market.
Det betyder att det går att handla andelar i dessa ETPer genom de flesta svenska banker och Internetmäklare, till exempel DEGIRO, Nordnet, Aktieinvest och Avanza
Nyheter
INSU ETF ger exponering mot amerikanska försäkringsbolag
Publicerad
3 timmar sedanden
13 maj, 2024
Invesco Dow Jones US Insurance UCITS ETF Acc (INSU ETF), med ISIN-nummer IE0007UJ6IE0, försöker spåra Dow Jones U.S. Select Insurance-index. Dow Jones U.S. Select Insurance-index följer den amerikanska försäkringssektorn.
Denna börshandlade fonds TER (total cost ratio) uppgår till 0,35 % p.a. Invesco Dow Jones US Insurance UCITS ETF Acc är den enda ETF som följer Dow Jones U.S. Select Insurance-index. ETFen replikerar det underliggande indexets prestanda genom full replikering (köper alla indexbeståndsdelar). Utdelningarna i ETFen ackumuleras och återinvesteras i den börshandlade fonden.
Denna ETF lanserades den 10 juli 2023 och har sin hemvist i Irland.
Produktbeskrivning
Invesco Dow Jones US Insurance UCITS ETF Acc syftar till att uppnå den totala nettoavkastningen för Dow Jones U.S. Select Insurance Index (”Referensindexet”), minus påverkan av avgifter.
Referensindex är ett börsvärdevägt index som representerar resultatet för stora, medelstora och små försäkringsbolag på den amerikanska marknaden. Referensindexet är konstruerat från Dow Jones U.S. Broad Stock Market Index (”Moderindex”) genom att använda indexleverantörens kriterier för att inkludera värdepapper som klassificeras som Full Line Insurance, Property & Casualty Insurance och Livförsäkringsbolag enligt S&P Dow Jones industriklassificeringssystem. Värdepapper måste också ha ett floatjusterat börsvärde på minst 500 miljoner USD för att komma in i referensindexet och minst 250 miljoner USD för att vara kvar i referensindexet.
Fonden strävar efter att uppnå sitt mål genom att köpa och hålla, så långt det är möjligt och praktiskt, alla värdepapper i referensindex i sina respektive vikter. Fonden kommer att sträva efter att balansera om sina innehav i linje med förändringar i referensindexet, som ombalanseras på kvartalsbasis.
Denna ETF hanteras passivt.
Handla INSU ETF
Invesco Dow Jones US Insurance UCITS ETF Acc (INSU ETF) är en börshandlad fond (ETF) som handlas på London Stock Exchange.
London Stock Exchange är en marknad som få svenska banker och nätmäklare erbjuder access till, men DEGIRO gör det.
Börsnoteringar
| Börs | Valuta | Kortnamn |
| London Stock Exchange | GBX | INSX |
| London Stock Exchange | USD | INSU |
Största innehav
| Namn | ISIN | Vikt % |
| CHUBB LTD CHF24.15 | CH0044328745 | 11.56% |
| PROGRESSIVE CORP USD1 | US7433151039 | 10.28% |
| ARTHUR J GALLAGHER & CO USD1 | US3635761097 | 6.65% |
| AMERICAN INTERNATIONAL GROUP USD2.5 | US0268747849 | 6.06% |
| TRAVELERS COS INC/THE NPV | US89417E1091 | 5.36% |
| METLIFE INC USD0.01 | US59156R1086 | 4.93% |
| PRUDENTIAL FINANCIAL INC USD0.01 | US7443201022 | 4.75% |
| AFLAC INC USD0.1 | US0010551028 | 4.75% |
| ALLSTATE CORP USD0.01 | US0200021014 | 4.16% |
| ARCH CAPITAL GROUP LTD USD0.01 | BMG0450A1053 | 4.14% |
Innehav kan komma att förändras
• Bitcoin continues to consolidate above 60k USD as the market is gradually entering dull seasonality from June onwards
• Our in-house “Cryptoasset Sentiment Indicator” continues to hover around neutral levels in sentiment
• Unprofitable BTC miners are coming under pressure following the Halving judging by the recent decline in network hash rate
Chart of the Week
Performance

Last week, cryptoassets underperformed traditional financial assets like equities or Gold as Bitcoin continued to consolidate above 60k USD.
It appears as if the market is currently lacking new positive catalysts after the US and Hong Kong spot ETF approvals and the Bitcoin Halving. Moreover, we are gradually entering dull seasonality from June onwards as the summer months have historically shown below-average returns for Bitcoin in the past.
Moreover, increasing US recession risks towards the summer as outlined in our latest monthly report could provide a temporary headwind for Bitcoin and cryptoassets as our own analyses still imply that Bitcoin’s performance continues to be dominated by global growth expectations.
Our base case is that the market continues to consolidate until macro risks have cleared/materialized and the positive performance effects from the Halving start to kick in around August 2024 as outlined in our special report about the Halving.
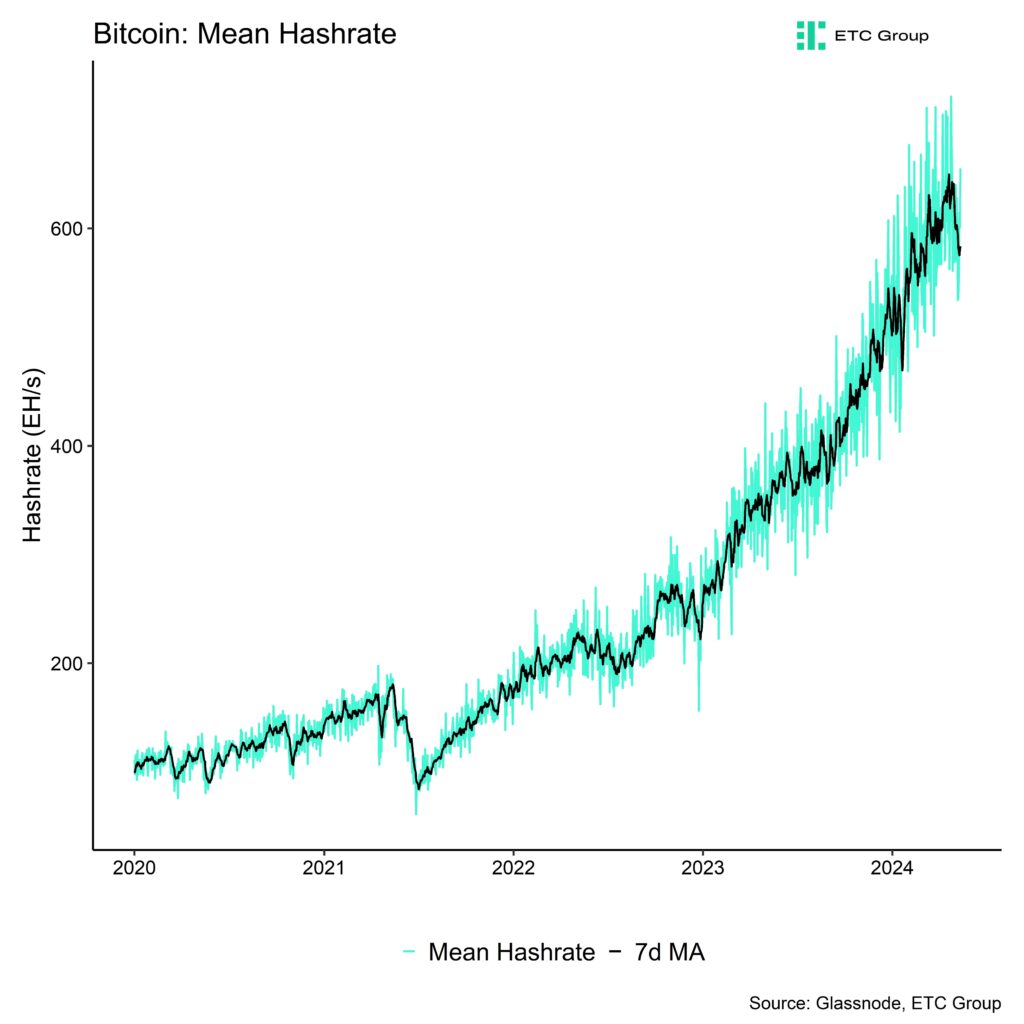
In the meantime, unprofitable BTC miners could come under pressure and there seems to be first evidence of that happening judging by the recent decline in network hash rate (Chart-of-the-Week). More specifically, the 7-day moving average of
Bitcoin’s hash rate has already declined by around -8% since the Halving took place on the 20 th of April.
In addition, last week also saw the 4th negative difficulty adjustment this year as it took BTC miners on average longer than 10 minutes to find the correct hash for a block. This is additional evidence that the network hash rate has been reduced.
In fact, the average BTC miner’s revenue has declined significantly as both the block subsidy and transaction fees have declined significantly since the Halving. Daily aggregate miner revenues have dropped to around ~28 mn USD, down from ~72 mn USD at the time of the Halving. That being said, there is no sign of significant distribution of bitcoins by BTC miners yet based on aggregate BTC miner balances.
There have been no significant transfers from miner wallets to exchange wallets either more recently.
Increasing selling pressure by BTC miners could be a headwind in the short term.
Furthermore, selling pressure could also materialize via fund outflows from crypto ETPs as traditional investors could distribute some of their crypto holdings for liquidity reasons in case of increasing US recession risks mentioned above.
This is something that we will continue to monitor over the coming weeks.
On a positive note, overall exchange inflows that are usually a good barometer for overall selling pressure have abated more recently and neither short- nor long-term holders are currently distributing coins in a significant way. Besides, global crypto ETPs still saw net inflows overall over the past week despite ongoing GBTC outflows in the US.
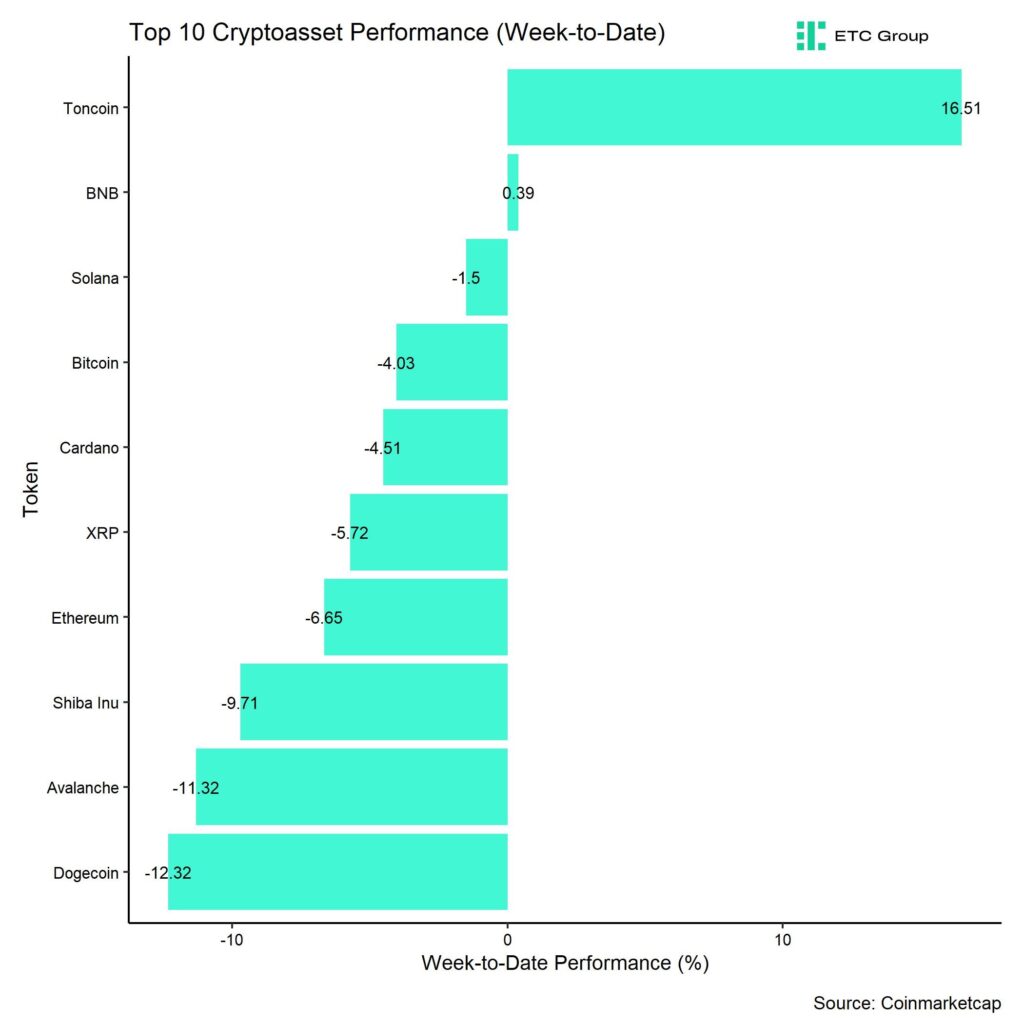
In general, among the top 10 crypto assets, Toncoin, BNB, and Solana were the relative outperformers.
However, overall altcoin outperformance vis-à-vis Bitcoin remained relatively low, with only around 40% of our tracked altcoins managing to outperform Bitcoin on a weekly basis.
Sentiment
Our in-house “Cryptoasset Sentiment Index” continues to hover around neutral levels in sentiment. The more recent correction has only led to a slight decrease in sentiment so far.
At the moment, 5 out of 15 indicators are above their short-term trend.
Last week, there were significant reversals to the downside in global crypto ETP fund flows and the Crypto Fear & Greed Index.
That being said, the Crypto Fear & Greed Index still signals ”Greed” again as of this morning.
Performance dispersion among cryptoassets has continued to remain low.
Altcoin outperformance vis-à-vis Bitcoin was still subdued, with around 40% of our tracked altcoins that have outperformed Bitcoin on a weekly basis. At the same time, Ethereum continued to underperform Bitcoin last week.
In general, increasing (decreasing) altcoin outperformance tends to be a sign of increasing (decreasing) risk appetite within cryptoasset markets.
Meanwhile, sentiment in traditional financial markets remains relatively elevated, judging by our own measure of Cross Asset Risk Appetite (CARA).
Fund Flows
Last week, we saw a slight reversal in global crypto ETPs with around +25.7 mn USD in net inflows, up from around -372.4 mn USD the week prior based on Bloomberg data.
Global Bitcoin ETPs saw net inflows of +92.5 mn USD of which +117.0 mn (net) were related to US spot Bitcoin ETFs alone. Hong Kong spot Bitcoin ETFs already experienced net outflows of around -40.9 mn USD last week according to data provided by Bloomberg.
The ETC Group Physical Bitcoin ETP (BTCE) also saw net outflows equivalent to -33.4 mn USD while the ETC Group Core Bitcoin ETP (BTC1) saw minor net inflows of +0.7 mn USD last week.
The Grayscale Bitcoin Trust (GBTC) continued to experience net outflows of approximately -171.1 mn USD last week while other major US spot Bitcoin ETFs were able to attract new capital, e.g. iShares’ IBIT with net inflows of around +48.2 mn USD.
In contrast to Bitcoin ETPs, Global Ethereum ETPs saw a decline in ETP flows last week, with net outflows of around -63.5 mn USD. This was mostly due to significant outflows from Hong Kong spot Ethereum ETFs that saw -46.5 mn USD in net outflows last week, according to data provided by Bloomberg.
In general, there seems to be an emerging pattern in crypto ETP fund flows that while global Bitcoin ETP flows continue to be dominated by US spot Bitcoin ETF flows, global Ethereum ETP fund flows are increasingly dominated by Hong Kong spot Ethereum ETF flows.
Meanwhile, the ETC Group Physical Ethereum ETP (ZETH) saw neither in- nor outflows (+/- 0 mn USD). The ETC Group Ethereum Staking ETP (ET32) experienced some net outflows (-1.5 mn USD) last week.
Besides, Altcoin ETPs ex Ethereum experienced only minor net inflows of around +5.7 mn USD last week.
Besides, Thematic & basket crypto ETPs experienced some net outflows of -9.0 mn USD, based on our calculations. The ETC Group MSCI Digital Assets Select 20 ETP (DA20) did experience neither in- nor outflows last week (+/- 0 mn USD).
Besides, the beta of global crypto hedge funds to Bitcoin over the last 20 trading days continued to increase to around 1.06. This implies that global crypto hedge funds have significantly increased their market exposure and have currently a slightly more than neutral exposure to Bitcoin.
On-Chain Data
As the market has rebounded from oversold levels at the beginning of May, on-chain data for Bitcoin remain somewhat mixed.
As mentioned above, unprofitable BTC miners could come under pressure and there seems to be first evidence of that happening judging by the recent decline in network hash rate (Chart-of-the-Week).
More specifically, the 7-day moving average of Bitcoin’s hash rate has already declined by around -8% since the Halving took place on the 20th of April.
In this context, the decline in active addresses to year-to-date lows appears to be somewhat concerning. On a positive note, overall network activity based on a variety of metrics still implies that Bitcoin’s network activity is still near all-time highs as the transaction count remains relatively high. This is not related to high inscription demand but related to genuine transaction demand.
Coming to Bitcoin’s hash rate, last week also saw the 4th negative difficulty adjustment this year as it took BTC miners on average longer than 10 minutes to find the correct hash for a block. This is additional evidence that the network hash rate has been reduced.
In fact, the average BTC miner’s revenue has declined significantly as both the block subsidy and transaction fees have declined significantly since the Halving. Daily aggregate miner revenues have dropped to around ~28 mn USD, down from ~72 mn USD at the time of the Halving.
That being said, there is no sign of significant distribution of bitcoins by BTC miners yet based on aggregate BTC miner balances. There have been no significant transfers from miner wallets to exchange wallets either more recently.
Increasing selling pressure by BTC miners could be a headwind in the short term.
Meanwhile, the increase in accumulation activity observed last week has started to decelerate a bit but is still comparatively high. Furthermore, whales continue to take coins off exchange on a net basis.
However, intraday net buying minus selling volumes on spot Bitcoin exchanges remained negative over the past week largely due to the deceleration in US spot Bitcoin ETF net inflows since March.
A renewed improvement in net buying volumes on spot exchanges is highly dependent on a resumption of higher flows into US and global Bitcoin ETP flows.
Futures, Options & Perpetuals
Last week, both BTC futures and perpetual open interest saw a slight increase in BTC-terms which seems to be related to a net increase in short open interest. In other words, BTC futures traders have started building up more downside exposure over the past week.
Meanwhile, both BTC short and long futures liquidations remained relatively low last week. The Bitcoin futures basis continued to move sideways last week. At the time of writing, the Bitcoin futures annualized basis rate stands at around 8.7% p.a.
Perpetual funding rates also remained slightly positive throughout the week.
Bitcoin options’ open interest decreased slightly last week as BTC option traders seem to have reduced their exposure of puts relative to calls. Relative put-call volume ratios remained well behaved last week.
However, the 25-delta BTC 1-month option skew increased slightly implying an increased demand for puts relative to calls.
BTC option implied volatilities have decreased slightly compared to the prior week. Implied volatilities of 1-month ATM Bitcoin options are currently at around 51.9% p.a., down from 53.1% p.a. the week prior.
Bottom Line
• Bitcoin continues to consolidate above 60k USD as the market is gradually entering dull seasonality from June onwards
• Our in-house “Cryptoasset Sentiment Indicator” continues to hover around neutral levels in sentiment
• Unprofitable BTC miners are coming under pressure following the Halving judging by the recent decline in network hash rate
To read our Crypto Market Compass in full, please click the button below:

This is not investment advice. Capital at risk. Read the full disclaimer
© ETC Group 2019-2024 | All rights reserved

Valour lanserar Internet Computer (ICP) och Toncoin (TON) ETP i Norden

INSU ETF ger exponering mot amerikanska försäkringsbolag

Crypto Market Compass | 13. May 2024

Sveriges enda riktiga råvarufond har öppnat

IBCQ ETF investerar i företagsobligationer från hela världen och valutasäkras till Euro

ETFmarknaden i Europa firar sitt 24-årsjubileum med tillgångar på två biljoner USD

Tillgång till obligationsmarknaden för företagsobligationer från utvecklade marknader

Vilken är den bästa fond som följer Nasdaq-100?

De mest populära börshandlade fonderna april 2024

Några av de bästa guldfonderna
Populära
-

 Nyheter4 veckor sedan
ETFmarknaden i Europa firar sitt 24-årsjubileum med tillgångar på två biljoner USD
-

 Nyheter4 veckor sedan
Tillgång till obligationsmarknaden för företagsobligationer från utvecklade marknader
-

 Nyheter2 veckor sedan
Vilken är den bästa fond som följer Nasdaq-100?
-

 Nyheter2 veckor sedan
De mest populära börshandlade fonderna april 2024
-

 Nyheter1 vecka sedan
Några av de bästa guldfonderna
-

 Nyheter5 dagar sedan
Endast en tredjedel av brittiska privatinvesterare har hört talas om ansvarsfulla investeringar eller ESG
-

 Nyheter1 dag sedan
Sveriges enda riktiga råvarufond har öppnat
-

 Nyheter3 veckor sedan
U.S. Global Investors tar över HANetf Travel


