
Nyheter
Has Gold’s Cyclical Bear Market Found a Base?
Has Gold’s Cyclical Bear Market Found a Base? Van Eck Global’s gold specialist Joe Foster shares his monthly perspective on the gold market.
Gold Markets Eye Fed’s December Move
Once again, we must report that the outlook for the Federal Reserve Bank’s (Fed’s) rate decision influenced the movements in the gold price in October. Leaving rates unchanged is considered supportive for gold because it implies weakness in the economy, a lower U.S. dollar, and potentially lower real rates. Gold advanced on October 2 when disappointing September U.S. non-farm payrolls meant lower odds of a Fed rate increase. Gold reached its $1,191 per ounce high for the month on October 15 following retail sales that were below expectations and producer prices that fell more than forecasts predicted. Poor economic results continued with the release of downward pointing monthly reports for durable goods, consumer confidence, and other leading indicators. However, on October 28, the Fed released its post-FOMC (Federal Open Market Committee) meeting statement, which the market interpreted as increasing the likelihood of a December rate hike. In the statement, the Fed dropped previous warnings on global risk and focused on gains in household spending. As a result of the Fed’s comments, the gold price partially lost earlier gains and ended the month with a $27.09 advance (2.4%) at $1,142.16 per ounce.
Gold Stocks Perk Up
Gold stocks perked up in October, although they also saw weakness following the FOMC statement. In October, the NYSE Arca Gold Miners Index1 gained 9.2% while the Market Vectors Junior Gold Miners Index2 advanced 5.1%. Third quarter reporting started in the last week of October and will run into November. So far we are pleased with the sector’s improving operating performance. In our opinion, companies have done a good job driving down costs and early reports suggest this trend is continuing. For example, Agnico Eagle Mines Limited (7.7% of INIVX net assets) lowered the midpoint of its all-in mining cost guidance from $880 per ounce to $850, Newmont (1.9% of net assets) from $950 per ounce to $910, and Eldorado Gold Corporation (4.8% of net assets) from $925 per ounce to $870. [Access a current list of INIVX holdings.]
Positive Trends Since July
A symptom of the economic weakness in China is its foreign exchange (forex) reserves, which have been in decline since June 2014 and are down $329 billion (8.6%) so far this year. Despite this, the Peoples Bank of China (PBOC) continues to buy significant amounts of gold to add to its forex reserves. In July, the PBOC began announcing monthly changes in its official gold reserves. For the third quarter, the PBOC added 50 tonnes, which exceeds its annualized pace of 100 tonnes per year for the last six years. Meanwhile, the Chinese Gold and Silver Exchange Society believes gold consumption may match or exceed the record set in 2013. Robust Chinese demand helps underpin prices in an otherwise weak market.
Since gold fell to its cycle low of $1,072 per ounce in July, we feel it has embarked on a positive trend. Each time gold makes new lows in the bear market, we see a similar pattern, and investors wonder whether this positive trend is sustainable. The recent fundamental drivers have been safe haven3 demand due to jitters over the collapse of the Chinese stock market in August and uncertainty surrounding the Fed’s rate decision. It feels as if markets are being held hostage until the next FOMC meeting in December. Perhaps there will be answers to the multitude of questions that create uncertainty: Will rates be increased? How will markets react? How much is already priced into the gold market? How much is priced into the U.S. dollar? How will emerging economies behave? What will be the pace of rate increases? Will they have to reverse course? Until there is more clarity, it is difficult to say whether this is another false start for gold or the beginning of a lasting trend.
Analyzing Gold and Gold Equities
Many who follow gold stocks are puzzled by the depths to which they have fallen. There are several ways of analyzing this, some of which are misleading. Chart 1 shows the ratio of the NYSE Gold Miners Index (GDM) to gold at all-time lows, well below the levels of the 2008 credit crisis crash or the 1980–2001 secular bear market. This chart depicts the unprecedented decline in gold stocks.

Source: Bloomberg, Van Eck Research. Not illustrative of an investment in the Fund. Historical information is not a forecast of future events, a guarantee of future results or investment advice. Current market conditions may not continue.
The GDM index saw its cycle low of 348 on September 11, 2015. The last time it was this low was in 2002 when gold was $300 per ounce. We do not believe that this means stocks are anticipating much lower gold prices. The average all-in mining cost for our coverage universe is $920 per ounce. We do not know of any mines that are producing gold for $300 per ounce. In fact, in our view, high cost mines would begin shutting down at around the $1,000 per ounce level and the entire industry would likely to cease to exist long before gold reached $300.
These can be valid ways of looking at markets, however, for gold and gold stocks they are misleading because they fail to capture important changes in the fundamentals of the industry over the past 15 years. To demonstrate and quantify these changes, we look to Chart 2. This chart uses the same data as Chart 1, but displays it as an x-y plot, rather than a ratio.

Source: Bloomberg, Van Eck Research. Not illustrative of an investment in the Fund. Historical information is not a forecast of future events, a guarantee of future results or investment advice. Current market conditions may not continue.
The first thing to notice is that gold and the GDM form three distinct trends over different periods. The transition between trends is shown as open circles. The correlation statistics (R-squared) for each trend is close to a perfect 1.00,4 which means that there is indeed a very strong correlation between gold bullion and gold shares.
Each trend is positioned progressively to the right at higher gold prices. This means that higher gold prices have been required to maintain the same GDM value. Each time the trend shifts from A to B to C, stocks are de-rating due to a loss in value. In the late 1990s, many companies became heavily hedged, locking in future production at low prices. When the bull market started, they were unable to take advantage of higher prices until in the 2000s, when they started spending billions of dollars to buy back their hedge books. As a result of what appear to be irresponsible hedging policies, gold stocks devalued from Trend A to B. The good news is that today the industry remains essentially unhedged, not wanting to repeat the mistakes of the past.
A different type of mistake caused the second devaluation form Trend B to C. The global mining industry was the victim of double-digit cost inflation during the 2008 to 2011 period of Trend B. The gold miners were not immune to this, and shareholders saw profit margins squeezed and capital cost escalations that diminished returns on new projects. Frustrated by the relentless rise in costs and missed expectations, the market de-rated the sector to its current Trend C. As has been the case with hedging, we believe the industry will not repeat the mistakes of the past. Managements are now focused on maintaining operational excellence and preserving margins.
To be fair, in the 1990s there were many companies with policies against hedging, and more recently there have been many with prudent cost controls. We have aimed to generate alpha5 in our portfolios by avoiding hedged producers and investing in companies with low costs and manageable debt. However, the majors have struggled the most with the problems that have plagued the industry. These companies dominate the indices and they are the “go-to” names for large generalist investors. In our view, poor leadership has cast a negative image across the broader industry.
We do not believe the industry will encounter further de-ratings in the future. We believe that a “Trend D” is not in the cards because the hard lessons that have been learned will not be forgotten, and companies should be able to maintain value. It is also unlikely that the industry re-rates higher towards Trend B. In order to create a positive step-change in value, it would take revolutionary technology or substantially more high-grade discoveries that enable low-cost mines to be built. While some companies are likely to make game-changing discoveries, we do not see it happening for the industry as a whole. Budgets have been slashed and geologic limitations have made exploration success harder to come by.
This Cyclical Bear Market Continues to Find a Base
This means that Trend C is probably the “new normal”, and, if so, what can we expect? The stocks are exhibiting considerable beta6 to the gold price. From the September close of $1,142 per ounce, a $100 (8.7%) change in the gold price caused a 36.4% change in the GDM along Trendline C. At higher gold prices the beta diminishes, but is still significant. For example, a $100 (6.2%) change from $1,600 per ounce causes a 13.7% change in the GDM along the trendline. Fundamentally, we explain this through optionality and leverage. At lower gold prices the volatility increases as stocks trade more like pure options. Around the $1,000 per ounce gold price, the industry does not generate any free cash and has little intrinsic value. However, there is still investment demand for the equities as options on higher gold prices.
Leverage at low gold prices also causes increased volatility and beta. Operating leverage increases when earnings and cash flows are at depressed levels. Small changes in the gold price can provide large percentage changes in earnings. For companies with high debt loads, there is also substantial financial leverage at low gold prices because so much of their cash flow is tied up in servicing debt.
While the near-term outlook for gold is murky, we expect to see plenty of volatility as this cyclical bear market continues to find a base.
by Joe Foster, Portfolio Manager/Strategist
With more than 30 years of gold industry experience, Foster began his gold career as a boots on the ground geologist, evaluating mining exploration and development projects. Foster offers a unique perspective on gold and the precious metals asset class.
Important Information For Foreign Investors
This document does not constitute an offering or invitation to invest or acquire financial instruments. The use of this material is for general information purposes.
Please note that Van Eck Securities Corporation offers actively managed and passively managed investment products that invest in the asset class(es) included in this material. Gold investments can be significantly affected by international economic, monetary and political developments. Gold equities may decline in value due to developments specific to the gold industry, and are subject to interest rate risk and market risk. Investments in foreign securities involve risks related to adverse political and economic developments unique to a country or a region, currency fluctuations or controls, and the possibility of arbitrary action by foreign governments, including the takeover of property without adequate compensation or imposition of prohibitive taxation.
Please note that Joe Foster is the Portfolio Manager of an actively managed gold strategy.
Any indices listed are unmanaged indices and include the reinvestment of all dividends, but do not reflect the payment of transaction costs, advisory fees or expenses that are associated with an investment in the Fund. An index’s performance is not illustrative of the Fund’s performance. Indices are not securities in which investments can be made.
1NYSE Arca Gold Miners Index (GDMNTR) is a modified market capitalization-weighted index comprised of publicly traded companies involved primarily in the mining for gold. 2Market Vectors Junior Gold Miners Index (MVGDXJTR) is a rules-based, modified market capitalization-weighted, float-adjusted index comprised of a global universe of publicly traded small- and medium-capitalization companies that generate at least 50% of their revenues from gold and/or silver mining, hold real property that has the potential to produce at least 50% of the company’s revenue from gold or silver mining when developed, or primarily invest in gold or silver. 3Tail risk is the risk of an asset or portfolio of assets moving more than three standard deviations from its current price. 4S&P 500® Index (S&P 500) consists of 500 widely held common stocks covering industrial, utility, financial, and transportation sectors. 5Dot-com bubble grew out of a combination of the presence of speculative or fad-based investing, the abundance of venture capital funding for startups and the failure of dotcoms to turn a profit. Investors poured money into internet startups during the 1990s in the hope that those companies would one day become profitable, and many investors and venture capitalists abandoned a cautious approach for fear of not being able to cash in on the growing use of the internet. 6Source: Bloomberg.
Please note that the information herein represents the opinion of the author and these opinions may change at any time and from time to time. Not intended to be a forecast of future events, a guarantee of future results or investment advice. Historical performance is not indicative of future results; current data may differ from data quoted. Current market conditions may not continue. Non-Van Eck Global proprietary information contained herein has been obtained from sources believed to be reliable, but not guaranteed. No part of this material may be reproduced in any form, or referred to in any other publication, without express written permission of Van Eck Global. ©2015 Van Eck Global.


Nyheter
Nya obligationsfonder från Amundi ger tillgång till eurostatsobligationer från europeiska länder

Valour Chainlink (LINK) SEK är en börshandlad produkt som spårar priset på LINK, den inhemska kryptovalutan i Chainlinks ekosystem.
Chainlink är ett decentraliserat orakelnätverk som underlättar smarta kontrakt på blockchain-plattformar för att säkert ansluta till verkliga data, vilket möjliggör genomförandet av förtroendefria och manipuleringssäkra avtal. Det fungerar som en brygga mellan blockkedjebaserade smarta kontrakt och externa datakällor, vilket ger en pålitlig och decentraliserad lösning för att föra information utanför kedjan till blockkedjan.
Produktinformation
| Emittent | Valour Inc. |
| Namn | Valour Chainlink (LINK) SEK |
| ISIN | CH1161139592 |
| Valoren | 116113959 |
| Basvaluta | SEK |
| Underliggande tillgång | CHAINLINK (LINK/USD) |
| Förfallodag | Open-Ended |
| Förvaltningskostnad | 1,9% |
Handla Valour Chainlink (LINK)
Valour Chainlink (LINK) är en europeisk börshandlad produkt som handlas på bland annat Nordic Growth Market.
Det betyder att det går att handla andelar i denna ETP genom de flesta svenska banker och Internetmäklare, till exempel DEGIRO, Nordnet, Aktieinvest och Avanza.
Börsnoteringar
| Börs | Kortnamn | Valuta |
| Nordic Growth Market | VALOUR CHAINLINK (LINK) SEK | SEK |
Nyheter
Bitcoin Warms up to Climate Goals and Ethereum’s Next Milestone: What Happened in Crypto This Week?
• European Economy Booms while Regulators Consider Adopting Crypto
• Bitcoin’s Growing Fundamentals and Institutionalization
• Ethereum’s Next Leap Forward: A Glimpse at the Upcoming Upgrade
European Economy Booms while Regulators Consider Adopting Crypto
Europe’s economy has exceeded expectations, with Germany’s gross domestic product (GDP) for Q1 2024 increasing by 0.2%, compared to the previous quarter’s reading of -0.5%. Additionally, France, Italy, and Spain are also seeing progress, picking up the bloc’s GDP from -0.1% to 0.3%. This is a good sign that Europe is on the right track away from a recession. Matching the positive outlook, regulators appear receptive to including new alternative assets within the EU’s most established regulatory framework.
Namely, the European Securities and Markets Authority (ESMA) is considering cryptoassets, among other asset classes like commodities and precious metals, in its Undertakings for Collective Investment in Transferable Securities (UCITS). Similar to mutual funds in the U.S., UCITS funds can be registered and sold in any country in the EU using unified regulatory and investor protection requirements. These funds are considered safe, well-regulated investments, hence their €12T market valuation and popularity among pension funds and risk-averse investors.
On May 7, ESMA invited investors and trade associations, among others, for a consultation to assess possible benefits and risks of UCITS gaining exposure to the selected 19 asset classes, having until August 7 to gather input. This is important since UCITS accounts for 75% of all collective retail investments in the EU. Thus, if the conclusions of this consultation are in favor of adopting crypto, it would attract an influx of investors and bring more regulated accessibility to this asset class. Moreover, although still under consultation, ESMA’s deliberation adds more credibility to crypto, considering the regulator’s renowned strict regulatory standards.
Further, the EU’s inflation is inching towards the 2% target, overshooting by only 0.4% in the past month, a level the U.S. is yet to achieve, with March’s inflation hitting 3.5%. Later today, a strong gauge for inflation is coming out, the Producer Price Index (PPI), measuring the change in the price of finished goods and services sold by producers. With the last consumer price index (CPI) disappointing, all eyes are on the CPI print coming out this Wednesday, along with data on retail sales. Although optimism seems to have checked out, a cooled inflation rate would recover investors’ appetite for risk-on assets like crypto, instigating more flows into Bitcoin spot ETFs, which have been especially quiet over the past week, as shown in Figure 1.
Figure 1: US Spot Bitcoin ETFs Flows

Source: Glassnode
Nevertheless, Bitcoin’s narrative has been growing beyond its primary use case as a store of value, with companies and governments alike leveraging Bitcoin mining to reduce their negative impact on the environment, ironically something Bitcoin is often scrutinized for.
Bitcoin’s Growing Fundamentals and Institutionalization
On May 7, Genesis Digital Assets and Argentina’s state-owned YPF Luz, the country’s largest producer of oil and gas with a ∼40% share in 2021, announced their opening of a Bitcoin mining facility. The data center takes ‘stranded gas,’ a byproduct of oil and gas production that would otherwise be flared and contribute to greenhouse gas emissions, to power the mining operation with the potential to reduce carbon dioxide equivalent emissions by 25-63%. Notably, 50 major oil and gas companies, representing over 40% of global petroleum production, signed the Oil and Gas Decarbonization Charter (OGDC), thereby committing to end gas flaring by 2030. The Argentinian project serves as a prime example of how companies can achieve the goals outlined in the OGDC, an approach likely to be replicated by others potentially using Bitcoin.
Aside from the obvious environmental benefits, projects like these actually strengthen Bitcoin’s network! More miners joining the fray means greater computing power, reflected by the growing hash rate in Figure 2. This results in a more secure network, as 51% attacks become more costly to execute successfully. The development comes at a crucial point in time, calming fears over miners exiting the network to cover costs, a dynamic often witnessed post-halving and one we explored in our Bitcoin Halving Report.
Figure 2 – Bitcoin Growing Hash Rate

Source: 21co on Dune
On a more familiar note, institutions continue to gobble up Bitcoin as an investment opportunity. The recent 13F filings mentioned last week revealed a growing appetite for Bitcoin as investment managers continue to disclose their U.S. equity holdings to the SEC. Quantitative trading firm Susquehanna holds over $1B in Bitcoin ETFs, with Boston-based hedge fund Bracebridge disclosing their $380M position too. Furthermore, in Japan, a weakened yen and government debt reaching 250% of GDP confirms sustained economic pressure, which has led early-stage investment firm Metaplanet to adopt Bitcoin as a strategic reserve. They have acquired over $7M since April, another testament to Bitcoin’s value proposition as a safe haven. The continuous adoption of Bitcoin is no surprise, given the accessibility of Bitcoin ETFs to traditional institutions through a regulated and familiar investment vehicle.
The positive Bitcoin sentiment is amplified by continuous innovation on the network itself. Bitcoin’s prime scaling solution, the Lightning Network, has taken a significant leap forward. By leveraging the Taproot Asset Upgrade, the Lightning Network successfully tested a protocol for issuing stablecoins directly on Bitcoin. This underscores the trend of Bitcoin’s growing use cases following the launch of Runes, which unlocked the ability to launch fungible tokens on Bitcoin. The recent surge in on-chain activity is reminiscent of the ERC-20 explosion in Ethereum’s early days, and stablecoins would truly unlock Bitcoin’s DeFi potential. They facilitate a wide range of transactions, shown below by Ethereum stablecoins amassing $3.8T in 2024 processed volume so far.
Figure 3 – Ethereum Stablecoin Volume
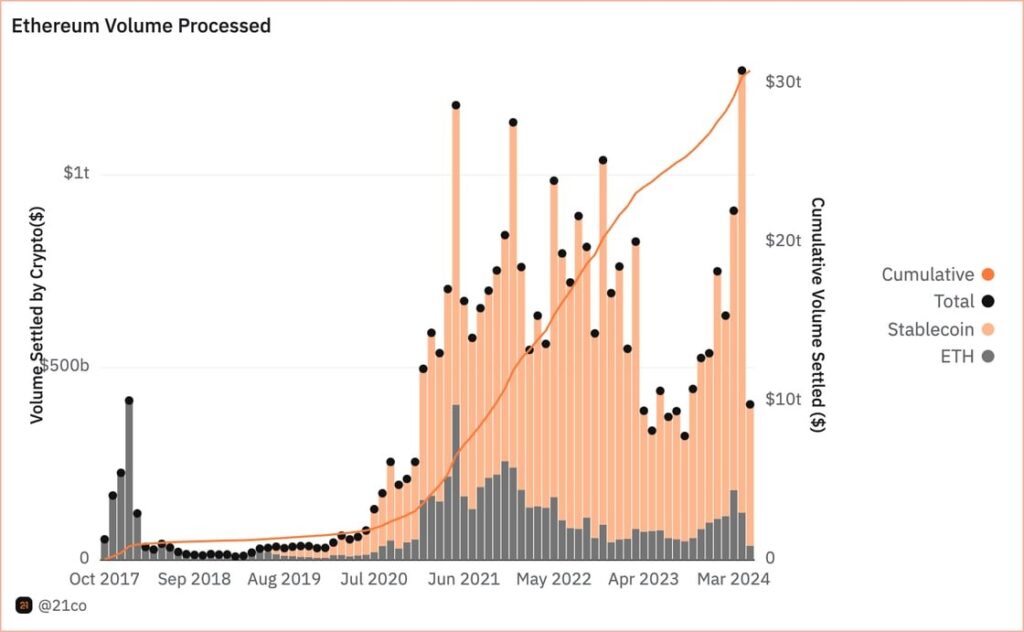
Source: 21co on Dune
While still in the early stages, this development would also significantly boost miner revenue, offering them a much-needed additional income stream through transaction fees, following the halving of block rewards last month. The potential of stablecoins on Bitcoin will be monitored going forward, as they have clear implications for the network’s potential on-chain footprint.
Ethereum’s Next Leap Forward: A Glimpse at the Upcoming Upgrade
More information is finally starting to come out regarding Ethereum’s next major upgrade, slated for late this year or early next year. Known as Pectra, the upgrade promises to introduce a range of enhancements aimed at bolstering the network’s stability and refining user experience. For example, the upgrade will raise the maximum stake per validator from 32 to 2,048 ETH, streamlining the management process for large validators who spread their stake across multiple wallets. Moreover, Pectra will tackle the problem of empty accounts, those with zero assets or funds, by removing them from the network. This action reduces the network’s state size, which effectively leads to lighter transaction processing.
Although the upgrade will incorporate various Ethereum Improvement Proposals (EIPs), one in particular stands out. Referred to as EIP 7702, Vitalik Buterin’s new proposal aims to expand upon the advancements made in Account Abstraction (AA) on Ethereum by refining certain concepts introduced in an earlier proposal, EIP 3074. As a quick recap, AA transforms users’ wallets, externally owned accounts (EOAs), into more sophisticated accounts resembling smart contracts, enhancing security, flexibility, and simplified user management. That said, EIP 7702 addresses some of EIP 3074 criticisms by steering clear of dependencies on EOA-specific functionalities. It aims to establish a versatile system capable of meeting the evolving needs of the Ethereum ecosystem while helping to reduce technical debt for the network
However, EIP 7702 proposes several other enhancements, including batched transactions, which could enhance transaction efficiency and even reduce fees by consolidating multiple user actions. Another exciting feature is the introduction of s sponsored transactions, which allow third-party applications to cover transaction fees for consumers, an ideal solution for onboarding new users. Finally, the upgrade could make users’ accounts resistant to threats from quantum computing. That said, with the proposal’s introduction of a new transaction type enabling EOAs to temporarily transition into smart accounts, concerns arise regarding the heightened risk of malicious actors’ ability to swiftly drain user wallets. Nevertheless, Vitalik’s proposal is intriguing as it charts a more pragmatic course toward realizing the AA vision. This is pivotal because it echoes our thesis at 21Shares that crypto won’t onboard millions of more users without providing them with an intuitive interface resembling the user-friendly experience they are familiar with across Web2.
Now, while Ethereum’s long-term prospects remain promising, its status as a deflationary network has come under threat in recent weeks, as seen below in Figure 3. This decline is primarily attributed to decreasing on-chain activity, which peaked at the end of March. Furthermore, the DenCun upgrade, implemented in March, significantly reduced the costs L2s incurred for storing their data on Ethereum by 90%.
Figure 4 – Ethereum’s Inflation
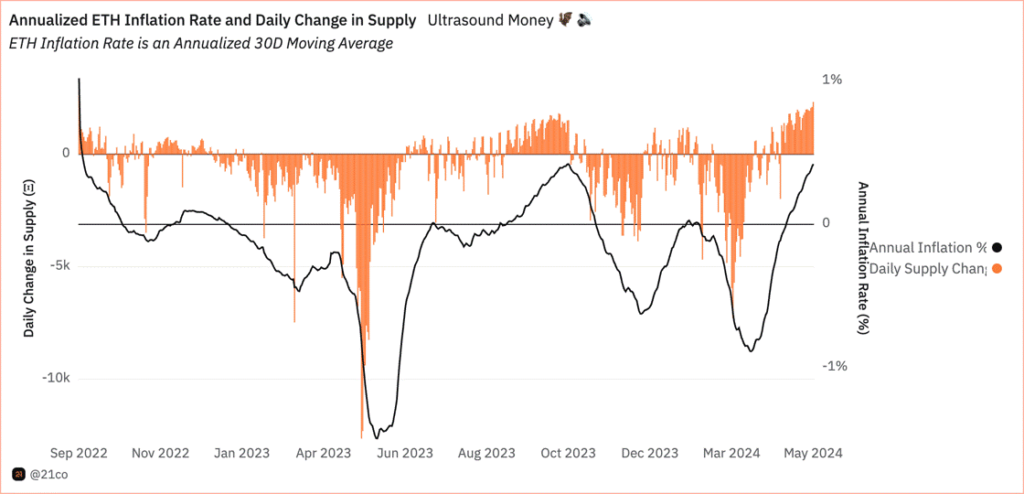
Source: 21co on Dune
It is worth noting that while it is currently more cost-effective for L2s to operate on Ethereum, these reduced costs will eventually onboard a larger user base. This will make it more feasible for applications, especially those requiring a high volume of interactions, to operate within the Ethereum ecosystem, which was previously economically unviable. A pivotal piece of evidence supporting this perspective is Arbitrum’s recent milestone, onboarding approximately 600K daily active users, as depicted in Figure 4. This likely influenced Securitize’s decision to propose deploying Blackrock’s BUIDL on Arbitrum, considering its position as the pioneering L2 platform with such a vibrant user base, alongside being the first L2 to process over $150B in swap volume on Uniswap, putting Arbitrum as the leading Ethereum scaling solution. Nevertheless, readers shouldn’t be wary, as we expect a broader spectrum of applications to arrive at the Ethereum network, helping to fill in the gap for Ethereum’s lost revenue while expanding the universe for what is possible within its ecosystem.
Figure 4 – Daily Active Users of Ethereum’s Leading Solutions

Source: GrowThePie
This Week’s Calendar
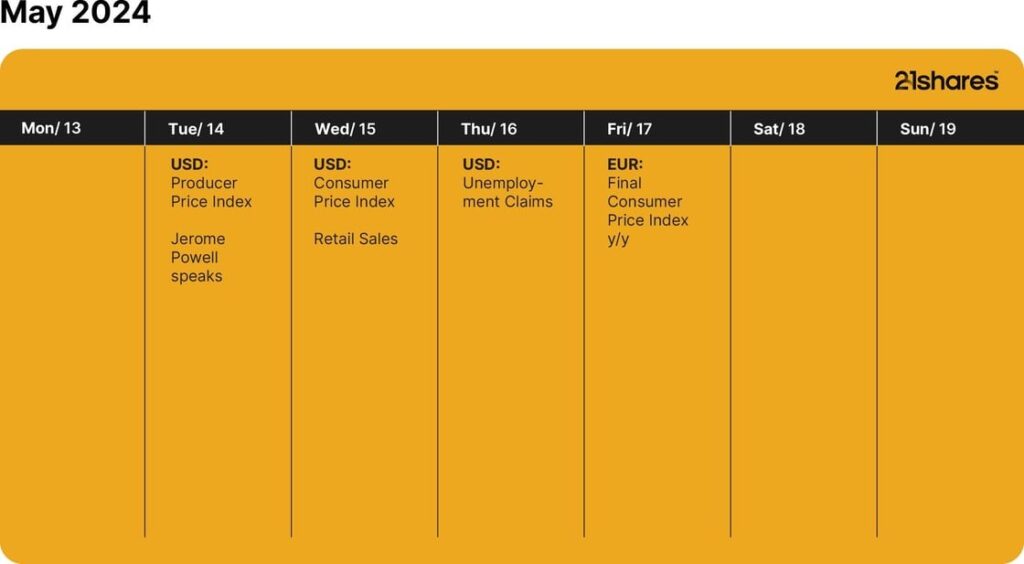
Source: Forex Factory, 21Shares
Research Newsletter
Each week the 21Shares Research team will publish our data-driven insights into the crypto asset world through this newsletter. Please direct any comments, questions, and words of feedback to research@21shares.com
Disclaimer
The information provided does not constitute a prospectus or other offering material and does not contain or constitute an offer to sell or a solicitation of any offer to buy securities in any jurisdiction. Some of the information published herein may contain forward-looking statements. Readers are cautioned that any such forward-looking statements are not guarantees of future performance and involve risks and uncertainties and that actual results may differ materially from those in the forward-looking statements as a result of various factors. The information contained herein may not be considered as economic, legal, tax or other advice and users are cautioned to base investment decisions or other decisions solely on the content hereof.


Nya obligationsfonder från Amundi ger tillgång till eurostatsobligationer från europeiska länder

Valour Chainlink (LINK) SEK ger exponering mot kryptovalutan LINK
Bitcoin Warms up to Climate Goals and Ethereum’s Next Milestone: What Happened in Crypto This Week?

CRPA ETF investerar i företagsobligationer och återinvesterar utdelningen

Timely and concise insights on Bitcoin & Cryptoasset Markets

Vilken är den bästa fond som följer Nasdaq-100?

De mest populära börshandlade fonderna april 2024

Sveriges enda riktiga råvarufond har öppnat

Några av de bästa guldfonderna

Endast en tredjedel av brittiska privatinvesterare har hört talas om ansvarsfulla investeringar eller ESG
-
 Nyheter3 veckor sedan
Vilken är den bästa fond som följer Nasdaq-100?
-
 Nyheter3 veckor sedan
De mest populära börshandlade fonderna april 2024
-
 Nyheter5 dagar sedan
Sveriges enda riktiga råvarufond har öppnat
-
 Nyheter2 veckor sedan
Några av de bästa guldfonderna
-
 Nyheter1 vecka sedan
Endast en tredjedel av brittiska privatinvesterare har hört talas om ansvarsfulla investeringar eller ESG
-

 Nyheter3 veckor sedan
U.S. Global Investors tar över HANetf Travel
-
 Nyheter2 veckor sedan
BTC1 ETP spårar priset på kryptovalutan Bitcoin
-
 Nyheter2 veckor sedan
1VET ETP ger exponering mot Ethereum tillsammans med extra intäkter