
Nyheter
High Yield Recovers, Fallen Angels Soar

High Yield Recovers, Fallen Angels Soar. Fallen angel bonds continued their history of outperformance, ending the first quarter ahead of the broad high yield bond market (+6.54% vs. +3.25%), as measured by the BofA Merrill Lynch US Fallen Angel High Yield Index (H0FA) and BofA Merrill Lynch US High Yield Index (H0A0). The basic industry and energy sectors helped fallen angels’ performance, as oil prices bounced in February. Fallen angels are high yield corporate bonds that are originally issued with investment grade credit ratings. They offer a potential value proposition, as they tend to price in a high degree of risk ahead of downgrades to high yield, and may become oversold due to forced selling by institutional holders.
Fallen Angel Bonds Outperformed Broad High Yield in the First Quarter
Living up to their history of outperformance, fallen angel bonds (+6.54%) ended the first quarter having outperformed the broad high yield bond market (+3.25%) by 3.30%, as measured by the BofA Merrill Lynch US Fallen Angel High Yield Index (H0FA) and BofA Merrill Lynch US High Yield Index (H0A0).1 Fallen angels are high yield corporate bonds that are originally issued with investment grade credit ratings.
Heavier Allocations to Basic Industry and Energy Drove Positive Results
Relative to the broad high yield bond market, fallen angels’ recent outperformance was primarily due to their higher average allocations to the basic industry and energy sectors. Both of these sectors’ bonds appreciated in the first quarter, as oil prices recovered approximately 46% since mid-February.2
Chart 1. Year-to-Date Top/Bottom Three Sector Attribution
BofA Merrill Lynch US Fallen Angel High Yield Index (H0FA) vs. BofA Merrill Lynch US High Yield Index (H0A0)
(Click to enlarge) Source: FactSet. Data as of March 31, 2016. Past performance is no guarantee of future performance. Top and bottom three sector attribution of the BofA Merrill Lynch US Fallen Angel High Yield Index for fallen angels versus the BofA Merrill Lynch US High Yield Index for the broad high yield bond market. Figures are gross of fees, non-transaction based and therefore estimates only. Past performance is not indicative of future results. Attribution represents the opportunity cost of investment positions in a group relative to the overall benchmark.
2016 Energy Sector Bias
Over the first quarter, fallen angels’ energy allocation grew from about 13% to 25%, while the broad high yield bond market’s went from approximately 11% to 13%.3 The overweight bias occurred as a result of the energy sector’s struggles in 2015, which led to investment grade energy companies suffering credit deterioration being downgraded to high yield. Allocating to bonds that are under ratings pressure may be considered a contrarian investment approach, which has tended to work for fallen angels in the past. Fallen angels tend to price in a substantial amount of this risk ahead of the ratings downgrades and, in general, become oversold from institutional forced selling upon entering the (H0FA) index, creating a potential value proposition.
Higher Quality High Yield
Fallen angels are generally characterized by higher average credit quality than the broad high yield bond market. While fallen angel bonds currently have a higher allocation to the energy sector than the broad high yield bond market, energy fallen angels are diversified across industries and concentrated in bonds with BB-credit (below investment grade) ratings.
ANGL Ranks at Top of High Yield Bond Category
Market Vectors® Fallen Angel High Yield Bond ETF (ANGL), which seeks to track the BofA Merrill Lynch US Fallen Angel High Yield Index (H0FA), ranked at the top of the actively managed high yield bond category year to date and over multiple time horizons since its April 2012 inception.4
Chart 2. Performance Relative to Peer Group
Market Vectors Fallen Angel High Yield Bond ETF (ANGL) vs. Morningstar Active High Yield Bond Universe

(Click to enlarge) Source: Morningstar. Data as of March 31, 2016.
This chart is for illustrative purposes only. Index performance is not illustrative of fund performance. Fund performance current to the most recent month end is available by visiting vaneckvectors.com/etfs. Historical information is not indicative of future results. Current data may differ from data quoted. Past performance is no guarantee of future results; Market Vectors Fallen Angel High Yield Bond ETF commenced on April 10, 2012. An investor cannot invest directly in an index. The results assume that no cash was added to or assets withdrawn from the Index. Index returns do not represent Fund returns. The Index does not charge management fees or brokerage expenses, nor does the Index lend securities, and no revenues from securities lending were added to the performance shown. The actively managed high yield bond category is represented by the Morningstar Open End Funds – U.S. – High Yield Bond category. See index descriptions below.
About ANGL
Market Vectors® Fallen Angel High Yield Bond ETF (ANGL), which seeks to track the BofA Merrill Lynch US Fallen Angel High Yield Index (H0FA), ranked at the top of the actively managed high yield bond category1 year to date and over multiple time horizons since its April 2012 inception.
Market Vectors® Fallen Angel High Yield Bond ETF received a five-star rating from Morningstar, as of March 31, 2016. ANGL was rated against 646 funds in Morningstar’s high yield bond category over the last three years. Past performance is no guarantee of future results.5 Additional resources and information on Market Vectors Fallen Angel High Yield Bond ETF (ANGL) »
ETFs is authored by VanEck thought leaders. VanEck is the sponsor of Market Vectors ETFs and is currently among the largest providers of exchange traded funds (ETFs) in the U.S. and worldwide. Market Vectors ETFs empower investors to help build better portfolios with access to compelling investment themes and strategies. Our ETFs span many global asset classes, and are built to be transparent, liquid, and pure-play reflections of target markets.
Authored by Meredith Larson, Product Manager, ETFs
IMPORTANT DISCLOSURE
1Source: FactSet. Data as of March 31, 2016. Represented by the BofA Merrill Lynch US Fallen Angel High Yield Index (H0FA) and the BofA Merrill Lynch US High Yield Index (H0A0).
2Source: FactSet. Data as of March 31, 2016.
3Source: FactSet. Data from December 31, 2105 to March 31, 2016.
4Morningstar ratings: ©2016 Morningstar, Inc. All Rights Reserved. The information contained herein: (1) is proprietary to Morningstar; (2) may not be copied or distributed; and (3) is not warranted to be accurate, complete or timely. Neither Morningstar nor its content providers are responsible for any damages or losses arising from any use of this information. Past performance is no guarantee of future results. The peer group chart presents trailing total return percentile rankings against the Morningstar Open End Funds – U.S. – High Yield Bond category, which comprised 822 funds as of March 31, 2016.
5Morningstar ratings: ©2016 Morningstar, Inc. All Rights Reserved. The information contained herein: (1) is proprietary to Morningstar; (2) may not be copied or distributed; and (3) is not warranted to be accurate, complete or timely. Neither Morningstar nor its content providers are responsible for any damages or losses arising from any use of this information. Past performance is no guarantee of future results. For each fund with at least a three-year history, Morningstar calculates a Morningstar RatingTM based on a Morningstar Risk-Adjusted Return measure that accounts for variation in a fund’s monthly performance (including the effects of sales charges, loads, and redemption fees), placing more emphasis on downward variations and rewarding consistent performance. The top 10% of funds in each category receive 5 stars, the next 22.5% receive 4 stars, the next 35% receive 3 stars, the next 22.5% receive 2 stars and the bottom 10% receive 1 star. (Each share class is counted as a fraction of one fund within this scale and rated separately, which may cause slight variations in the distribution percentages.) The Overall Morningstar Rating for a fund is derived from a weighted average of the performance figures associated with its three-, five- and ten-year (if applicable) Morningstar Rating metrics. As of March 31, 2016, ANGL was rated against 646 high yield bond funds over the last three years. ANGL received a Morningstar Rating of 5 stars for 3-year rating. Past performance is no guarantee of future results.
Morningstar Open End Funds – U.S. – High Yield Bond category is comprised of open-end mutual funds with an investment objective to seek returns via significant exposure to low quality bonds, those that are either unrated or rated by a major agency as BB or lower.
Morningstar ETF – U.S. – High Yield Bond category is comprised of exchange-traded funds with an investment objective to seek returns via significant exposure to low quality bonds, those that are either unrated or rated by a major agency as BB or lower.
This content is published in the United States for residents of specified countries. Investors are subject to securities and tax regulations within their applicable jurisdictions that are not addressed on this content. Nothing in this content should be considered a solicitation to buy or an offer to sell shares of any investment in any jurisdiction where the offer or solicitation would be unlawful under the securities laws of such jurisdiction, nor is it intended as investment, tax, financial, or legal advice. Investors should seek such professional advice for their particular situation and jurisdiction.
The indices listed are unmanaged indices and do not reflect the payment of transaction costs, advisory fees, or expenses that are associated with an investment in any underlying exchange-traded funds. Index performance is not illustrative of fund performance. Fund performance current to the most recent month end is available by visiting vaneck.com. Historical performance is not indicative of future results; current data may differ from data quoted. Indexes are unmanaged and are not securities in which an investment can be made.
BofA Merrill Lynch US Fallen Angel High Yield Index (H0FA) is a subset of the BofA Merrill Lynch US High Yield Index (H0A0), including securities that were rated investment grade at time of issuance. Performance and characteristics of the BofA Merrill Lynch US Fallen Angel High Yield Index (H0FA) are quoted throughout this material. H0FA is representative of the entire fallen angel high yield corporate bond market. H0FA does not represent the performance or yield of the Market Vectors Fallen Angel High Yield Bond ETF.
BofA Merrill Lynch US High Yield Index (H0A0) is comprised of below-investment grade corporate bonds (based on an average of Moody’s, S&P, and Fitch) denominated in U.S. dollars. The country of risk of qualifying issuers must be an FX-G10 member, a Western European nation, or a territory of the U.S. or a Western European nation.
Merrill Lynch, Pierce, Fenner & Smith Incorporated and its affiliates (”BofA Merrill Lynch”), indices, and related information, the name ”BofA Merrill Lynch,” and related trademarks, are intellectual property licensed from BofA Merrill Lynch, and may not be copied, used, or distributed without BofA Merrill Lynch’s prior written approval. The licensee’s products have not been passed on as to their legality or suitability, and are not regulated, issued, endorsed, sold, guaranteed, or promoted by BofA Merrill Lynch. BOFA MERRILL LYNCH MAKES NO WARRANTIES AND BEARS NO LIABILITY WITH RESPECT TO THE INDICES, ANY RELATED INFORMATION, ITS TRADEMARKS, OR THE PRODUCT(S) (INCLUDING WITHOUT LIMITATION, THEIR QUALITY, ACCURACY, SUITABILITY, AND/OR COMPLETENESS).
Fund shares are not individually redeemable and will be issued and redeemed at their Net Asset Value (NAV) only through certain authorized broker-dealers in large, specified blocks of shares called ”creation units” and otherwise can be bought and sold only through exchange trading. Creation units are issued and redeemed principally in kind. Shares may trade at a premium or discount to their NAV in the secondary market.
An investment in the Fund may be subject to risk which include, among others, credit risk, call risk, and interest rate risk, all of which may adversely affect the Fund. High yield bonds may be subject to greater risk of loss of income and principal and are likely to be more sensitive to adverse economic changes than higher rated securities. International investing involves additional risks which include greater market volatility, the availability of less reliable financial information, higher transactional and custody costs, taxation by foreign governments, decreased market liquidity and political instability. The Fund’s assets may be concentrated in a particular sector and may be subject to more risk than investments in a diverse group of sectors.
Investing involves substantial risk and high volatility, including possible loss of principal. Bonds and bond funds will generally decrease in value as interest rates rise. An investor should consider the investment objective, risks, charges and expenses of the Fund carefully before investing. To obtain a prospectus and summary prospectus, which contains this and other information, call 800.826.2333 or visit vaneck.com/etfs. Please read the prospectus and summary prospectus carefully before investing.


• Regulatory Crackdowns Fire Up in April
• Macro Uncertainty, Geopolitical Headwinds, and Bitcoin’s Fourth Halving
• The Arrival of Ethereum’s Most Anticipated Application
Macro Uncertainty, Geopolitical Headwinds, and Bitcoin’s Fourth Halving
April brought a challenging landscape for Bitcoin. Geopolitical tensions flared in the Middle East when Israel targeted the Iranian Consulate in Syria on the 1st of April. In an unprecedented response, Iran retaliated directly with a drone strike against Israel, intensifying hostilities. The event contributed to a decline in the stock market and a temporary pullback in Bitcoin’s price. As mentioned two weeks ago, although Bitcoin historically served as a safe haven during crises like the Russian Invasion of Ukraine, its response to Iran-Israeli escalation may have been adverse.
However, a closer look at the market reveals a more nuanced picture. The impact on Bitcoin was primarily felt in the futures market, where open interest peaked at $35 billion on the day of the Consumer Price Index (CPI) print, leading to significant liquidations when inflation came in hotter than expected for the fourth month running. Resilience in the labor market, coupled with strong domestic demand, is evidence that despite Fed efforts, the US is not yet in a position for rate cuts, which may pose further turbulence for risk-on assets. Encouragingly, long-term holders demonstrated resilience amidst escalating tensions. Unlike short-term fears reflected in futures markets, long-term holders increased their supply by 0.1% over the past week, for the first time since January, as the Israeli response seemingly coincided with a local bottom for long-term holder supply. This is a bullish signal, showcasing belief in the asset, irrespective of recent market activity. Nevertheless, we can see that BTC will continue to be stuck in the $60K – $70K range until we get more clarity on the macroeconomic and geopolitical front.
Figure 1: Bitcoin Short-Term Holder Supply vs. Long-Term Holder Supply

Source: Glassnode
Despite the macroeconomic headwinds, significant progress was made in the institutional adoption of Bitcoin. Despite a break in Blackrock’s Bitcoin ETF 71-day net inflow streak, the conclusion of the 90-day due diligence period for fund managers considering the spot ETFs revealed that over 100 institutions, such as BNY Mellon and Banco do Brazil, are exposed to Bitcoin. Morgan Stanley is also actively exploring allowing 15,000 brokers to provide this exposure to their clients. They also filed to broaden access to BTC ETFs by expanding it to 12 more funds, signifying the growing acceptance of Bitcoin by TradFi institutions. Finally, the launch of Bitcoin ETFs in Hong Kong marked a significant step towards adoption in Asia, potentially influencing other jurisdictions like South Korea, Japan, and Singapore to follow suit while expanding Bitcoin’s access to Hong Kong’s $1.15 trillion wealth management sector.
Beyond the market’s activity, April also marked a historic event for Bitcoin: the fourth halving, reducing Bitcoin’s annual inflation rate to below 1%, making it even scarcer than Gold. Historically, Bitcoin trades 50% down from its peak leading up to the halving. This year, Bitcoin defied historical trends, reaching a new all-time high prior to the halving, attributed to the surge in demand from the aforementioned US Bitcoin ETFs, coupled with ongoing technical advancements within the Bitcoin ecosystem, such as Ordinals, BRC-20s, and Runes, as touched upon in the last newsletter.
These advancements are transforming Bitcoin beyond its original vision as a purely decentralized payment network. The emergence of Ordinals and Runes has amplified on-chain activity, reflected in surging transaction fees. This is particularly beneficial for Bitcoin miners, who saw their block reward cut in half due to the halving. Higher transaction fees help compensate for this lost revenue, ensuring the continued security of the Bitcoin network. Notably, as shown in Figure 2, Bitcoin transaction fees made up 75% of Bitcoin miner revenue, soaring to $128 on the day of the halving. While the surge might have been driven by the desire to have a historical inscription, it does underscore the potential impact on miners’ revenue as Bitcoin’s on-chain ecosystem matures.
Figure 2: Bitcoin Miners Revenue
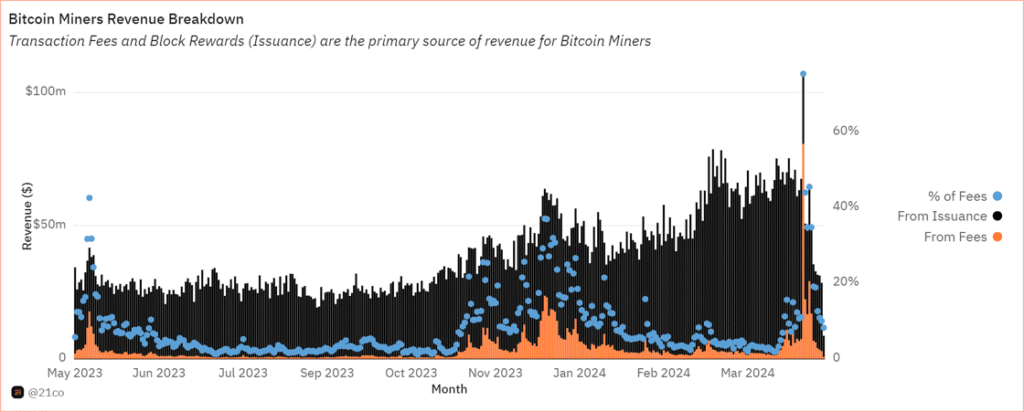
Source: 21.co on Dune
Launched in April, Runes Protocol offers a novel approach to creating fungible tokens on the Bitcoin network. It addresses inefficiencies associated with the BRC-20 standard, which have burdened the Bitcoin blockchain due to its inefficient data handling. Ultimately, Runes presents a key innovation that bolsters Bitcoin’s security budget by offering miners an alternative source of revenue, while reducing their dependence on block rewards. Runes has already rewarded miners with almost $150 million, impressively making up 80% of fees generated on the Bitcoin network on April 23, as shown below.
Figure 3: Share of Bitcoin Transaction Fees
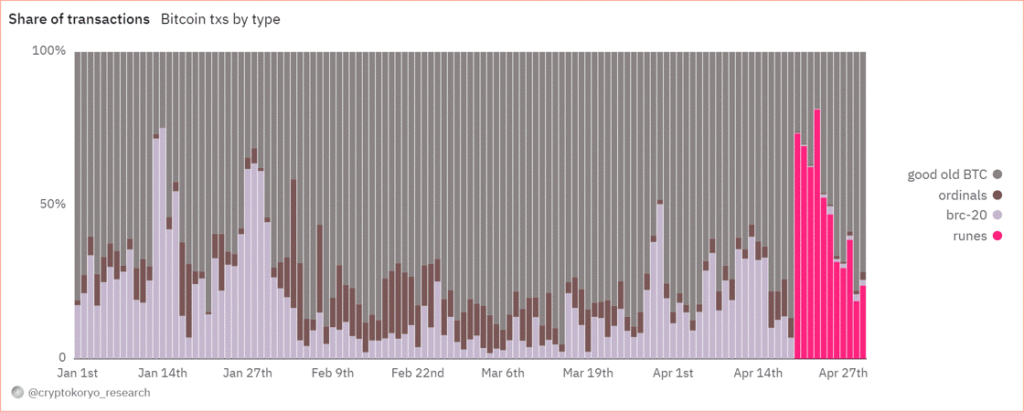
Source: CryptoKoryo on Dune
While Bitcoin’s daily transaction volume surpassed 1 million, rivaling Ethereum’s activity, the initial excitement surrounding Runes might recede before a more long-term, sustainable surge in the network’s DeFi activity. The initial phase often focuses on meme-like tokens attracting rapid but fleeting interest. However, the development of sophisticated DeFi protocols like exchanges and Automated Market Makers (AMMs) will enhance Bitcoin’s application layer, streamlining token trading similar to what ERC-20/ERC-721 standards did for Ethereum. This paves the way for a more robust and mature DeFi ecosystem on Bitcoin, which we will closely monitor in the months to come.
Regulatory Crackdowns Fire Up in April
April saw the continued regulation-by-enforcement trend, cracking down on non-custodial infrastructure and the Ethereum ecosystem. On April 10, the Securities and Exchange Commission (SEC) sent Wells Notices to Uniswap and Consensys for alleged violation of federal securities law. Uniswap announced its intention to resolve this through court. The details of the SEC’s Wells Notice remain unclear. However, it could have been triggered by Uniswap’s pending revenue-sharing initiative, which has had a domino effect on the ecosystem. In the short term, the crackdown could dissuade protocols from following suit, which would have incentivized their users to stake and delegate their tokens for a share of the revenue.
On April 25, Consensys filed a lawsuit against the SEC for “unlawful seizure of authority,” arguing that Ethereum is not a security nor that MetaMask is a securities broker. The recent crackdown could put a strain on the crypto infrastructure industry in the short term, as it could severely disrupt the ecosystem while encouraging companies to explore alternative jurisdictions aside from the U.S. market.
Earlier in February, the SEC adopted rules that widened its interpretation of a dealer to include “as part of a regular business” in addition to the initial definition, “any person engaged in the business of buying and selling securities . . . for such person’s own account through a broker or otherwise.” The newly adopted rules have now triggered an outcry in the crypto community, deeming the legislation too broad, as it includes average market participants in cryptoasset liquidity pools (liquidity providers), who essentially have a very different role than a broker.
For example, liquidity providers on Uniswap can be anyone, given they have the capital to deposit and earn yield, unlike professional market makers in traditional finance whose responsibilities extend beyond that. Providing liquidity on Uniswap is open to anyone to enable permissionless markets, which makes this an important characterization due to the impact it could have on how DeFi functions in the US. While the ongoing crackdown could cause uncertainty in the short term within the Ethereum ecosystem, regulatory clarity will ultimately be reached in the long run, as we’ve seen on several counts of hurdles over the past few years.
Ethereum’s Most Anticipated Application of the Year is Live
EigenLayer is finally live on Ethereum’s mainnet. It’s a new primitive that allows ETH users to “re-stake” their existing staked ETH to validate the security of external networks. EigenLayer has been eagerly anticipated as it optimizes capital efficiency by allowing users to earn additional yield on top of their native staking rewards. Further, it allows younger protocols to borrow the security assurances of Ethereum, circumventing the need to bootstrap their own security from scratch. This translates to a more cost-efficient approach while simultaneously bolstering their decentralization. Nevertheless, the protocol comes with inherent risks.
By opting to earn additional yield, users, and validators subject themselves to heightened smart contract risks as they become exposed to the vulnerabilities of both Ethereum and the additional protocols relying on its security. Moreover, a large portion of ETH could end up being “re-staked” in EigenLayer instead of just validating the security of Ethereum, creating a problem of misalignment. Simply, some validators might opt to maximize their profits by pursuing strategies that prioritize short-term gains over the long-term security of the network. Additionally, the growing enthusiasm for the protocol suggests that a significant portion of the crypto economy might rely on Ethereum’s security. Currently, 15% of all staked ETH is allocated towards Eigen’s re-staking strategy. The continuation of this trend could lead to centralization, posing a risk as Ethereum might inadvertently become a single point of failure over a longer time horizon.
Wide-spread slashing is another concern. In essence, if a substantial amount of ETH is re-staked in a singular protocol, then a slashing event due to unintended or malicious behavior could significantly impact honest ETH stakers. Thus, Eigen proposed a slashing committee comprising esteemed ETH developers and trusted community members, empowered to veto such occurrences and safeguard Ethereum’s integrity.
The final risk concerns a new breed of tokens known as Liquid re-staking Tokens (LRTs), which operate atop EigenLayer. LRTs, akin to Liquid Staking Tokens (LSTs) issued by the established Lido Protocol in 2021, aim to unlock similar capital efficiency by allowing users to use their re-staked ETH as collateral for lending and borrowing. Given that re-staked ETH in Eigen can’t be used across DeFi platforms, users have turned to LRT protocols like Ether.fi and Renzo to seek higher levels of capital flexibility, with their re-staked assets. For context, LRTs grew exponentially by a factor of 28 throughout Q1, increasing from nearly 100K units to the current figure of 2.8M, as shown in Figure 4, illustrating its soaring demand.
Figure 4: Growth of Liquid re-staking Tokens (LRTs) on EigenLayer
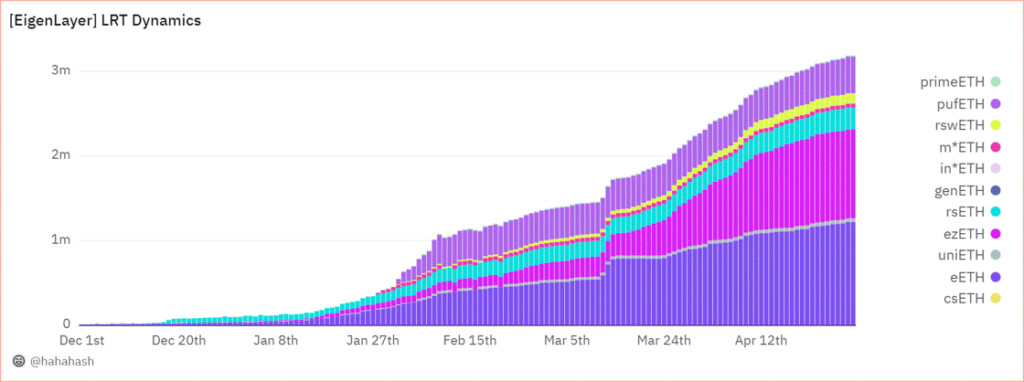
Source: @hahahash on Dune
While LRTs can offer amplified gains through leveraged lending, they can also exacerbate losses, increasing systemic risk in market downturns. Since some LRT protocols can’t offer withdrawals yet, users may be forced to swap their LRT tokens on thinly traded secondary markets, intensifying their decline. Last week, we saw an instance of this risk manifest when Renzo’s ezETH lost its peg. This happened as the ETH derivative experienced heavy selling on various exchanges, causing it to trade at over a 75% discount compared to ETH. This coincided with the company facing scrutiny over its controversial token distribution plan, which is scheduled to launch on April 30.
All in all, the impact of EigenLayer is not to be understated, as the excitement surrounding the new primitive has propelled it to become the second-largest protocol on Ethereum by Total Value Locked (TVL), boasting an impressive $15.6B. This already eclipses the TVL of established players like Solana by fourfold, highlighting the immense adoption that EigenLayer is witnessing despite its brief existence. Further, the excitement building up to its launch since it unveiled its roadmap in March has propelled the Ethereum validator entry queue to its highest level since October. The queue now necessitates a minimum waiting period of 8 days before new validators can join the network, as seen below in Figure 5. Nevertheless, stay tuned as we prepare to release a more in-depth exploration of EigenLayer risks over the coming weeks.
Figure 5: Ethereum Validator Entry Queue in Days

Source: ValidatorQueue
Next Month’s Calendar

Source: Forex Factory, 21Shares
Research Newsletter
Each week the 21Shares Research team will publish our data-driven insights into the crypto asset world through this newsletter. Please direct any comments, questions, and words of feedback to research@21shares.com
Disclaimer
The information provided does not constitute a prospectus or other offering material and does not contain or constitute an offer to sell or a solicitation of any offer to buy securities in any jurisdiction. Some of the information published herein may contain forward-looking statements. Readers are cautioned that any such forward-looking statements are not guarantees of future performance and involve risks and uncertainties and that actual results may differ materially from those in the forward-looking statements as a result of various factors. The information contained herein may not be considered as economic, legal, tax or other advice and users are cautioned to base investment decisions or other decisions solely on the content hereof.


Regulatory Crackdowns and Ethereum’s Most Anticipated Application

ETC Group lanserar BTC1, En unik Core Bitcoin ETP

LITM ETF ger exponering mot litium och batterier
Ombalansering av Valour Digital Asset Basket 10 (VDAB10) inkluderar Toncoin och Shiba Inu Coin

Vad är en utdelnings-ETF?

ETFmarknaden i Europa firar sitt 24-årsjubileum med tillgångar på två biljoner USD

Tillgång till obligationsmarknaden för företagsobligationer från utvecklade marknader

FUIG ETF investerar i hållbara företagsobligationer som följer Parisavtalet

Vilken är den bästa fond som följer Nasdaq-100?

Försvarsfond når förvaltad volym på 500 MUSD
-
 Nyheter2 veckor sedan
ETFmarknaden i Europa firar sitt 24-årsjubileum med tillgångar på två biljoner USD
-
 Nyheter2 veckor sedan
Tillgång till obligationsmarknaden för företagsobligationer från utvecklade marknader
-
 Nyheter4 veckor sedan
FUIG ETF investerar i hållbara företagsobligationer som följer Parisavtalet
-
 Nyheter4 dagar sedan
Vilken är den bästa fond som följer Nasdaq-100?
-
 Nyheter3 veckor sedan
Försvarsfond når förvaltad volym på 500 MUSD
-

 Nyheter4 veckor sedan
Vad händer härnäst för Bitcoin?
-

 Nyheter3 dagar sedan
De mest populära börshandlade fonderna april 2024
-

 Nyheter4 veckor sedan
Ny börshandlad fond från Deka ger tillgång till S&P 500-index