ETFS Multi-Asset Weekly – Markets see-saw as China slows down but US surges ahead
Highlights
• Commodities: Palladium and Platinum diverge after Volkswagen emissions scandal. • Equities: Global markets retrace losses after US GDP data surprises on the upside. • Currencies: Dollar firmer as stronger US GDP data backs Feds case for a 2015 rate hike. • ETF Securities will be hosting a Q4 update on the 8 October to look at trends for commodities, equities and currencies
Fed chair Yellen’s comments shadowed by upward revisions to US GDP data set the tone for a 2015 rate hike, boosting confidence in the world’s largest economy. This helped markets recuperate initial losses sparked by the weakest Chinese PMI reading seen in 6 years and an emissions scandal by the world’s largest automaker – Volkswagen. The repercussions of the Volkswagen emissions scandal were evident among the precious group metals (PGMs) with palladium rising 9.3% and platinum declining -3.6% this week as fears mounted over the preference for gasoline vs diesel cars.
Commodities
Palladium and Platinum diverge after Volkswagen emissions scandal. Platinum known for deriving 44% of its use in reducing emissions from diesel engines faced the brunt of the scandal in which Volkswagen rigged the software used in its diesel cars to cheat the US emissions test. Palladium benefitted as investors expect consumers to favour gasoline engines. The clean air drive initiative announced by China provided a further boost to palladium as more of the metal will be needed for pollution abatement. In the long term, stringent emissions regulations will require more loadings of PGMs in autocatalysts raising their demand outlook. After rallying to a one month high $1156 troy ounce, gold fell out of favour declining -0.68% after Fed chair Yellen’s comments kept a 2015 rate hike still on the cards. The rise in net gold imports from mainland China reaching a 3 month high and the upcoming wedding and festival season in India remains supportive of demand for the yellow metal.
Equities
Global markets retrace losses after US GDP data surprises on the upside. The deterioration in Chinese manufacturing data to a 6-1/2 year low and the emissions scandal by Volkswagen dealt serious blows to the market at the start of the week. However the stronger US GDP data coupled with favourable comments from Fed chair Yellen of a probable rate hike this year renewed investor’s risk appetite, allowing stocks to retrace initial losses for the week. In Europe, a rise in employment for the 11th straight month along with steady PMI data left ECB President Mario Draghi undecided on whether further quantitative easing was warranted. Investors remain cautious ahead of the Q3 earnings season after industrial bellwether Caterpillar slashed 10,000 jobs and warned of an uncertain global economic outlook.
Currencies
Dollar firmer as stronger US GDP data backs Feds case for a 2015 rate hike. Hawkish comments alluding to a probable rate hike this year by Fed chair Yellen, helped push the dollar up 0.92% for the week. A rise in consumer spending helped the US economy grow faster than expected in the second quarter aiding the case for a rate hike by the Fed. The euro ended the week lower despite a lack of dovish comments from ECB president Mario Draghi and a risk off rally. Norway’s central bank trimmed rates for a second time this year to 0.75%, hinting at the likelihood further rate cuts, in an effort to boost the economy dented by falling oil prices and rising household debt. The loonie reached an 11 year low as uncertainty rose ahead of Canada’s fiercely contested elections less than a month away.
For more information contact:
ETF Securities Research team ETF Securities (UK) Limited T +44 (0) 207 448 4336 E info@etfsecurities.com
Important Information
General
This communication has been issued and approved for the purpose of section 21 of the Financial Services and Markets Act 2000 by ETF Securities (UK) Limited (”ETFS UK”) which is authorised and regulated by the United Kingdom Financial Conduct Authority (”FCA”).
Nasdaq 100-indexet följer de 100 största aktierna noterade på Nasdaq-börsen. De utvalda företagen kommer huvudsakligen från sektorer som hårdvara och mjukvara, telekommunikation, detaljhandel och bioteknik – inklusive alla stora amerikanska teknikföretag. Däremot ingår inte företag från energi-, finans- och fastighetssektorerna i Nasdaq-100. Vilken är den bästa fond som följer Nasdaq-100?
I USA har den populära QQQ ETF, som spårar Nasdaq 100, varit tillgänglig sedan 1999. Den förvaltas av Invesco. Den europeiska motsvarigheten till denna ETF använder tickersymbolen eQQQ. Till skillnad från den amerikanska marknaden finns det dock flera ETF-leverantörer i Europa som spårar Nasdaq 100 – så det är värt att jämföra.
ETF-investerare kan dra nytta av värdeökningar och utdelningar från Nasdaq 100-beståndsdelarna. För närvarande spåras Nasdaq 100-indexet av tretton ETFer.
Förvaltningsarvode fond som följer Nasdaq-100
Nedan har vi listat förvaltningsarvoden för fond som följer Nasdaq-100. Samtliga dessa ETFer har en konkurrenskraftig prissättning, allt från AXA IM Nasdaq 100 UCITSETF USD Acc, som debiterar sina andelsägare 0,14 procent per år till iShares Nasdaq 100 UCITSETF (Acc) som tar ut 0,33 procent i arvode. I jämförelse kostar de flesta aktivt förvaltade fonder mycket mer avgifter per år.
Som alltid vill vi påminna att om det finns flera olika börshandlade fonder som täcker samma index eller segment är det förvaltningskostnaden som avgör. Antar vi att dessa Nasdaqfonder ger samma avkastning kommer den som har lägst avgift att utvecklas bäst, allt annat lika. Grundregeln är alltså, betala aldrig för mycket då detta kommer att äta upp din avkastning.
Nasdaq 100 ETFer i jämförelse
Förutom avkastning finns det ytterligare viktiga faktorer att tänka på när du väljer en Nasdaq 100 ETF. För att ge ett bra beslutsunderlag hittar du en lista över alla Nasdaq 100 ETFer med detaljer om vinstanvändning, fondens hemvist och replikeringsmetod.
Samtliga dessa ETFer är europeiska börshandlade fonder. Dessa fond handlas på flera olika börser, till exempel Deutsche Boerse Xetra och London Stock Exchange.
Det betyder att det går att handla andelar i denna ETF genom de flesta svenska banker och Internetmäklare, till exempel DEGIRO, Nordnet, Aktieinvest och Avanza.
India’s vibrant economy and structural growth opportunities continue to be the envy of many emerging markets. But somewhat unique to this market are tax implications that investors should be aware of. Our Franklin Templeton Global ETF team examines these structural issues in Asia’s third-largest economy.
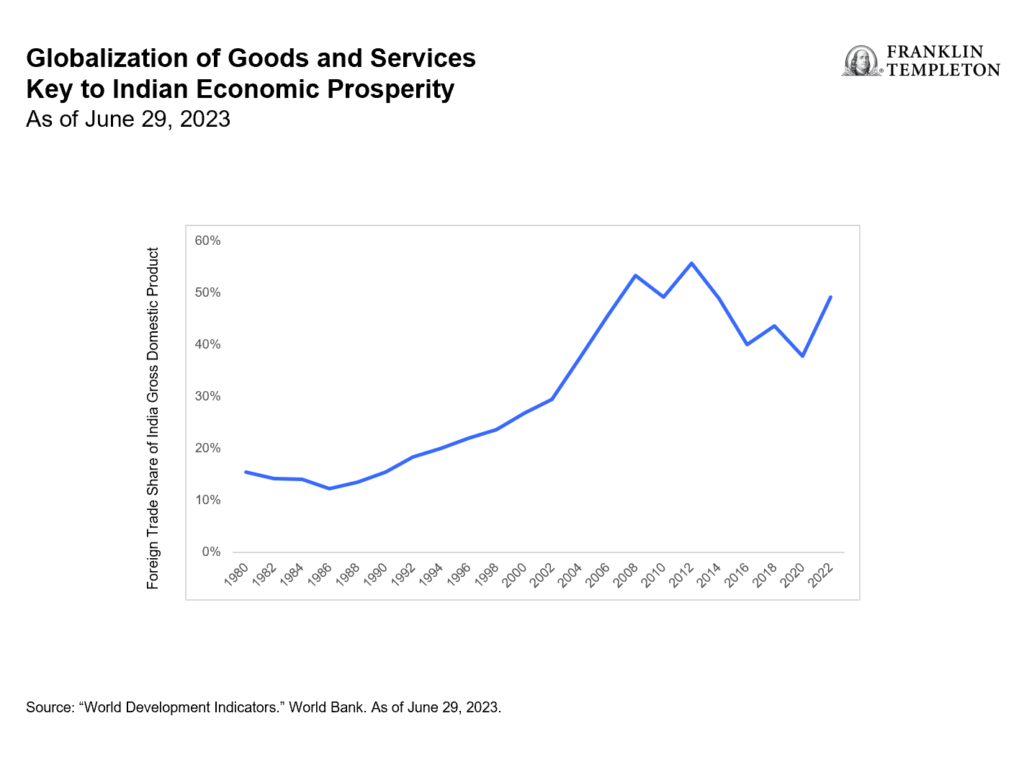
In merely a decade, India has taken a quantum leap from the world’s 11th largest economy to become its fifth largest. By many accounts, it is expected to remain one of the world’s fastest-growing major economies over the coming years. And even after a banner 2023 during which the country’s benchmark indexes surged and Indian Prime Minister Narendra Modi celebrated high-profile successes—from historic technological and space exploration achievements to rising global diplomatic clout—this election year has already marked more progress in supporting Modi’s pro-growth, pro-jobs efforts.
The world’s most populous nation has advanced ties with Western countries over free trade. In addition to agreements with Australia and the United Arab Emirates, it has worked to better integrate the “Global South’s” development needs and ambitions with that of the G20. Modi has touted innovative partnerships for a new multilateral rail and sea corridor to connect India with the Middle East and the European Union (EU)—seen as a counterweight to China’s vast Belt-and-Road infrastructure corridor.
India reached its latest notable trade pact, nearly 16 years in the making, in March with the European Free Trade Association—Iceland, Liechtenstein, Norway and Switzerland. The agreement lifts Indian tariffs to secure US$100 billion in foreign direct investment commitments from the non-EU markets to India across multiple sectors.
With India still an enviable investment powerhouse, it seems important to clarify a few aspects of this dynamic equity market.
How exchange-traded funds (ETFs) treat India capital gains tax (CGT)
Foreign investors should be aware that CGT is an integral part of investing in Indian equities that cannot be circumvented. Investors in India funds are subject to CGT implications regardless of fund provider, and CGT is based and calculated on a fund as a whole, not an individual investor’s position.
The details: Foreign investors owning local Indian stocks are subject to taxation on capital gains at a short-term rate of 15% for positions held for less than one year and at a long-term rate of 10% for positions held over one year.
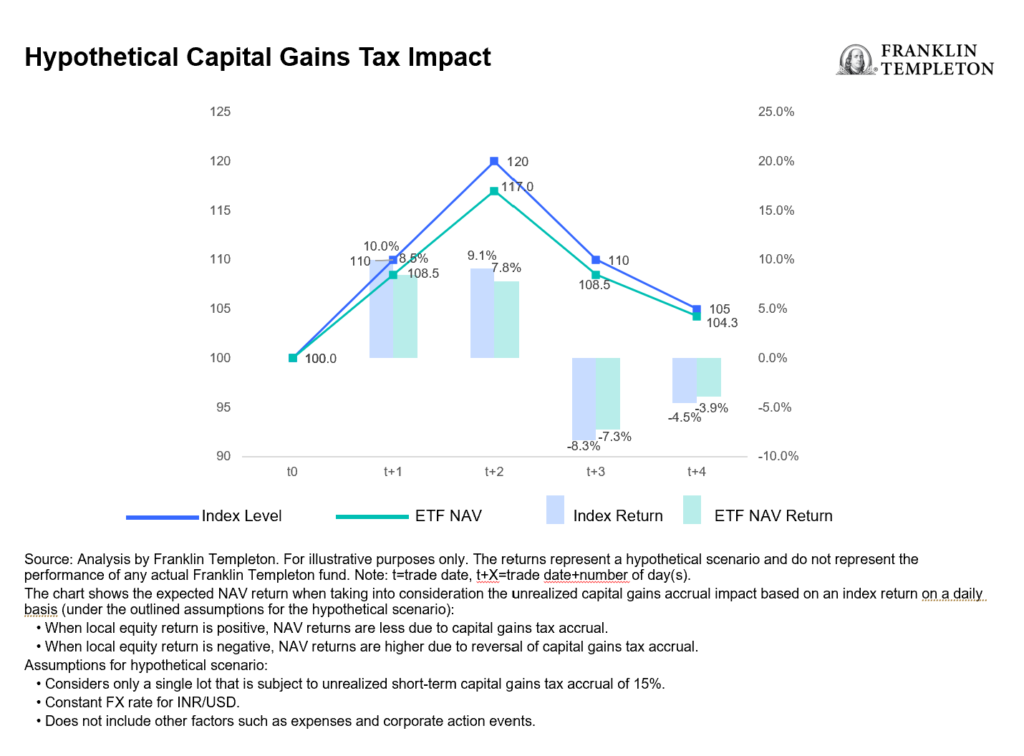
To accrue or not to accrue: Consistent with market practice for US-listed India ETF providers, Franklin Templeton accrues unrealized CGT in its daily net asset value (NAV). This can lead to differences in performance relative to the benchmark, which does not include CGT. As a result, rising markets will typically lead to fund underperformance against a benchmark, while weaker market environments will typically generate outperformance (provided the fund is in an unrealized capital gain position where the current market value of fund holdings is above their historical book cost). See chart below.
For UCITS-listed India funds, there is a divergence in methods utilized by fund providers in accruing and reporting CGT. Some do not accrue unrealized CGT in the NAV, but will charge CGT to investors directly at redemption, which we believe leaves investors with a level of opaqueness and uncertainty over their ultimate proceeds. This method also creates an elevated NAV compared to what investors will actually experience. While Franklin Templeton’s approach to CGT may at times lead to a higher tracking difference,1 we believe investors benefit from increased transparency and a more reflective experience.
The magnitude and impact of CGT for a specific fund is heavily dependent on several variables, such as the timing of purchases and sales, performance of the holdings and their volatility, and the size of flows in and out of the fund relative to its assets under management (AUM).
Understanding the impact: The CGT impact to fund performance is driven by the path of returns, timing of individual lots and price points. Very broadly speaking, in rising markets, an NAV-accruing fund will likely underperform its benchmark and vice versa.
Consideration of comparability: Because different providers handle CGT differently, the comparability of fund performance metrics may be affected. As investors, it’s prudent to consider how these nuances may influence investment decisions within the broader context of your financial strategy.
The bigger picture: While CGT considerations are important, they should be viewed within the broader spectrum of investment objectives and risk tolerance. Taking a long-term perspective and being mindful of other important characteristics of the investment vehicle of choice may aid in the decision-making process.
In summary, India remains an attractive investment destination with compelling growth prospects for its equity markets. Investors seeking India allocation through an ETF should be aware of the current tax regime and what varying methods of accounting methodologies really mean for fund valuation.
Xtrackers II Target Maturity Sept 2033 EUR Corporate Bond UCITS ETF 1D (XB33 ETF) med ISIN LU2673523564, försöker följa Bloomberg MSCI Euro Corporate September 2033 SRI-index. Bloomberg MSCI Euro Corporate September 2033 SRI-index följer företagsobligationer denominerade i EUR. Indexet speglar inte ett konstant löptidsintervall (som är fallet med de flesta andra obligationsindex). Istället ingår endast obligationer som förfaller mellan oktober 2032 och september 2033 i indexet (ETF kommer att stängas i efterhand). Indexet består av ESG (environmental, social and governance) screenade företagsobligationer. Betyg: Investment Grade.
Den börshandlade fondens TER (total cost ratio) uppgår till 0,12 procent p.a. Xtrackers II Target Maturity Sept 2033 EUR Corporate Bond UCITSETF 1D är den enda ETF som följer Bloomberg MSCI Euro Corporate September 2033 SRI-index. ETFen replikerar det underliggande indexets prestanda genom samplingsteknik (köper ett urval av de mest relevanta indexbeståndsdelarna). Ränteintäkterna (kupongerna) i ETFen delas ut till investerarna (Minst årligen).
Denna ETF lanserades den 8 november 2023 och har sin hemvist i Luxemburg.
Bloomberg MSCI Euro Corporate SRI PAB Index syftar till att spegla resultatet på följande marknad:
Minsta utestående belopp på 300 miljoner euro per obligation
Endast obligationer utgivna av företag med en MSCI ESG-rating på BBB eller högre och en MSCI ESG Impact Monitor över 1 ingår
Indexet övervakar absoluta växthusgasutsläpp (“GHG”) genom att sätta en initial 50 % avkolning av absoluta växthusgasutsläpp i förhållande till moderuniversumet följt av en årlig 7 % avkolningsbana för absoluta växthusgasutsläpp.
Obligationer utgivna av företag som är involverade i alkohol, tobak, hasardspel, vuxenunderhållning, genetiskt modifierade organismer (GMO), kärnkraft, civila skjutvapen, militära vapen (inklusive minor, klusterbomber, kemiska vapen) är undantagna.
Handla XB33 ETF
Xtrackers II Target Maturity Sept 2033 EUR Corporate Bond UCITSETF 1D (XB33 ETF) är en europeisk börshandlad fond. Denna fond handlas på Deutsche Boerse Xetra.
Det betyder att det går att handla andelar i denna ETF genom de flesta svenska banker och Internetmäklare, till exempel DEGIRO, Nordnet, Aktieinvest och Avanza.