Följ oss

Nyheter

U.S. Moats Outpace International Moats

Publicerad

den

U.S. Moats Outpace International Moats July showed contrasting results for the two Morningstar indices, although both were negatively impacted by the deepening weakness in the energy sector. For U.S. equities, the Morningstar® Wide Moat Focus IndexSM outperformed the S&P 500® Index

U.S. Moats Outpace International Moats July showed contrasting results for the two Morningstar indices, although both were negatively impacted by the deepening weakness in the energy sector. For U.S. equities, the Morningstar® Wide Moat Focus IndexSM outperformed the S&P 500® Index (+2.27% versus +2.10%). By contrast, for international equities the Morningstar® Global ex-US Moat Focus IndexSM trailed the MSCI All Country World Index ex USA (-1.80% versus -0.28%).

Domestic Equity Markets: GOOGL and AMGN Shine

Tech giant Google (GOOGL) was the top performer for U.S.-centric Morningstar Wide Moat Focus Index (MWMFTR) posting total return performance of +21.75%. Biotech giant Amgen (AMGN) also performed notably well (+15.03%), and had its fair value estimate raised by Morningstar analysts in July. By contrast, several of the Index’s energy sector firms struggled in July, including Williams (WMB) and Spectra (SE), which declined 8.56% and 7.18%, respectively.

International Equity Markets: Energy Was Draining

Many of the constituent companies in the internationally-focused Morningstar Global ex-US Moat Focus Index (MGEUMFUN) were subjected to the broad sell-off in commodities last month, notably gold miner Eldorado Gold (EGO) and agribusiness company Potash (POT). Mexico, Hong Kong, and Canada all weighed down Index performance for the month. By contrast, several international moat-rated companies supported the Index, led by industrials and consumer staples companies.

The Difference is Morningstar

The new Moat Investor Monthly highlights key insights and performance trends impacting global moat investing. Internationally-focused MOTI joins U.S.-focused MOAT to provide investors with global exposure to Morningstar’s moat methodology and valuation principals.

MOAT
Market Vectors
Morningstar Wide Moat ETF

Index:    Morningstar® Wide Moat Focus IndexSM (MWMFTR)
Focus:    Domestic

MOTI
Market Vectors
Morningstar International Moat ETF

Index:     Morningstar® Global ex-US Moat Focus IndexSM (MGEUMFUN)
Focus:     International

Important Disclosure

This commentary is not intended as a recommendation to buy or to sell any of the named securities. For the Indices and the ETFs MOAT and MOTI holdings will vary.

Index performance is not representative of fund performance. To view fund performance current to the most recent month end, call 800.826.2333 or visit vaneck.com.

An investor cannot invest directly in an index. Returns reflect past performance and do not guarantee future results. Results reflect the reinvestment of dividends and capital gains, if any. Index returns do not represent Fund returns. The Index does not charge management fees or brokerage expenses, nor does the Index lend securities, and no revenues from securities lending were added to the performance shown.

Fair value estimate: the Morningstar analyst’s estimate of what a stock is worth.

Price/Fair Value: ratio of a stock’s trading price to its fair value estimate.

The Morningstar® Wide Moat Focus IndexSM and Morningstar® Global ex-US Moat Focus IndexSM were created and are maintained by Morningstar, Inc. Morningstar, Inc. does not sponsor, endorse, issue, sell, or promote the Market Vectors Morningstar Wide Moat ETF or Market Vectors Morningstar International Moat ETF and bears no liability with respect to the ETFs or any security. Morningstar® is a registered trademark of Morningstar, Inc. Morningstar Wide Moat Focus Index and Morningstar Global ex-US Moat Focus Index are service marks of Morningstar, Inc.

The Morningstar Wide Moat Focus Index consists of 20 U.S. companies identified as having sustainable, competitive advantages and whose stocks are the most attractively priced, according to Morningstar.

The Morningstar Global ex-US Moat Focus Index consists of 50 companies outside of the U.S. identified as having sustainable, competitive advantages and whose stocks are the most attractively priced, according to Morningstar.

The S&P 500 Index consists of 500 widely held common stocks covering the leading industries of the U.S. economy.

MSCI All Country World Index ex USA captures large and mid cap representation across 22 Developed Markets countries (excluding the U.S.) and 23 Emerging Markets countries.

An investment in the Market Vectors Morningstar Wide Moat ETF (MOAT) may be subject to risks which include, among others, fluctuations in value due to market and economic conditions or factors relating to specific issuers. Medium-capitalization companies may be subject to elevated risks. The Fund’s assets may be concentrated in a particular sector and may be subject to more risk than investments in a diverse group of sectors.

An investment in the Market Vectors Morningstar International Moat ETF (MOTI) may be subject to risks which include, among others, fluctuations in value due to market and economic conditions or factors relating to specific issuers. Foreign and emerging markets investments are subject to risks, which include changes in economic and political conditions, foreign currency fluctuations, changes in foreign regulations, changes in currency exchange rates, unstable governments, and limited trading capacity which may make these investments volatile in price or difficult to trade. Medium-capitalization companies may be subject to elevated risks. The Fund’s assets may be concentrated in a particular sector and may be subject to more risk than investments in a diverse group of sectors.

Fund shares are not individually redeemable and will be issued and redeemed at their Net Asset Value (NAV) only through certain authorized broker-dealers in large, specified blocks of shares called ”creation units” and otherwise can be bought and sold only through exchange trading. Creation units are issued and redeemed principally in kind. Shares may trade at a premium or discount to their NAV in the secondary market. You will incur brokerage expenses when trading Fund shares in the secondary market. Past performance is no guarantee of future results. Returns for actual Fund investments may differ from what is shown because of differences in timing, the amount invested, and fees and expenses.

Investing involves substantial risk and high volatility, including possible loss of principal. An investor should consider the investment objective, risks, charges and expenses of a Fund carefully before investing. To obtain a prospectus and summary prospectus, which contain this and other information, call 888.MKT.VCTR | 888.658.8287. Please read the prospectus and summary prospectus carefully before investing.

Van Eck Securities Corporation, Distributor

Fortsätt läsa
Annons
Klicka för att kommentera

Skriv en kommentar

Din e-postadress kommer inte publiceras. Obligatoriska fält är märkta *

Nyheter

Valour lanserar Internet Computer (ICP) och Toncoin (TON) ETP i Norden

Publicerad

den

Valour lanserar tre banbrytande börshandlade produkter (“ETPs”) inklusive Valour Internet Computer (ICP) ETP, Valour Toncoin (TON) ETP och Valour Chainlink (LINK) ETP, som markerar betydande milstolpar i det nordiska investeringslandskapet.

Valour lanserar tre banbrytande börshandlade produkter (“ETPs”) inklusive Valour Internet Computer (ICP) ETP, Valour Toncoin (TON) ETP och Valour Chainlink (LINK) ETP, som markerar betydande milstolpar i det nordiska investeringslandskapet.

  • Nordens första i sitt slag: Valour Internet Computer (ICP) ETP och Valour Toncoin (TON) ETP är de första erbjudandena i sitt slag i Norden, som ger investerare oöverträffad tillgång till innovativa ekosystem.
  • Förenklad tillgång till banbrytande tillgångar: Handel med alla tre ETPer påbörjades den 10 maj 2024, med en förvaltningsavgift på 1,9 %. Dessa ETPer möjliggör sömlös tillgång till banbrytande digitala tillgångar, och erbjuder investerare förenklade möjligheter att engagera sig i den transformativa potentialen hos ICP, TON och LINK.
  • Toncoin (TON) Analystäckning: DeFi Technologies dotterbolag, Reflexivity Research, ett ledande forskningsföretag som specialiserat sig på att skapa högkvalitativa, djupgående forskningsrapporter för bitcoin- och kryptovalutaindustrin för att ge investerare värdefulla insikter, har initierat analystäckning om TON.

Valour som ger förenklad tillgång till digitala tillgångar, har lanserat tre ETPer. Bland dessa erbjudanden finns Valour Internet Computer (ICP) ETP och Valour Toncoin (TON) ETP, den första i sitt slag i Norden. Dessa åtföljs av Valour Chainlink (LINK) ETP, som ger förenklad tillgång till avancerade digitala tillgångar.

Handeln med alla tre ETPerna inleddes den 10 maj 2024, med en förvaltningsavgift på 1,9 %.

Valour Internet Computer (ICP) ETP

Valour Internet Computer (ICP) SEK ETP (ISIN: CH1213604510) erbjuder investerare oöverträffad tillgång till framtiden för webbutveckling genom att spåra priset på ICP, den infödda token som driver Internetdatorns ekosystem. Med sitt unika fokus på enkelhet och säkerhet kan investerare sömlöst engagera sig med ICP genom sina traditionella bank- eller mäklarkonton. ICP har ett börsvärde på 5,5 miljarder dollar och rankas tjugofjärde bland alla kryptovalutor globalt.

Internetdatorprojektet banar väg för en ny era av webbutveckling genom att skapa en decentraliserad och skalbar internetinfrastruktur. Genom att göra det möjligt för smarta kontrakt att köras direkt på sitt nätverk, eliminerar Internetdatorn behovet av traditionella serverbaserade arkitekturer, vilket inleder ett paradigmskifte inom webbutveckling. Detta innovativa tillvägagångssätt säkerställer större säkerhet, effektivitet och tillgänglighet för både utvecklare och användare.

Valour Toncoin (TON) ETP

Valour Toncoin (TON) SEK ETP (ISIN: CH1161139600) gör det möjligt för investerare att få tillgång till Toncoin, TONs infödda token, sömlöst och säkert via deras traditionella bank- eller mäklarkonto. Toncoin, med sitt fokus på snabba transaktionshastigheter och låga avgifter, ger en effektiv lösning för både inhemska och internationella betalningar, vilket gör det till ett attraktivt alternativ för olika finansiella tillämpningar. TON har ett börsvärde på $23,25 miljarder och rankas som nionde bland alla kryptovalutor globalt.

Toncoin, den infödda symbolen för TON, erbjuder ett robust och effektivt sätt att utbyta värde, som syftar till att effektivisera betalningsprocesser över olika finansiella landskap. Med sin betoning på snabba transaktionshastigheter och minimala transaktionsavgifter står Toncoin som en lovande lösning för både individer och företag som söker sömlösa betalningsupplevelser.

Företaget är också glada att meddela att dess dotterbolag, Reflexivity Research, ett ledande forskningsföretag som specialiserat sig på att skapa högkvalitativa, djupgående forskningsrapporter för bitcoin- och kryptovalutaindustrin för att ge investerare värdefulla insikter, har initierat forskningstäckning om TON. Rapporten finns här.

Valour Chainlink (LINK) ETP

Valour Chainlink (LINK) SEK (ISIN: CH1161139592) ETP kommer att göra det möjligt för investerare att få exponering mot LINK, enkelt och säkert, via sin bank eller mäklare. LINK har ett börsvärde på 13,63 miljarder dollar och rankas som artonde bland alla kryptovalutor globalt.

Chainlink, känt som ett decentraliserat orakelnätverk, spelar en avgörande roll för att möjliggöra smarta kontrakt på blockchain-plattformar för att säkert interagera med verklig data. Genom att fungera som en brygga mellan blockchain-baserade smarta kontrakt och externa datakällor, underlättar Chainlink genomförandet av förtroendefria och manipuleringssäkra avtal. Dess decentraliserade karaktär säkerställer tillförlitligheten och integriteten hos data, vilket förbättrar effektiviteten och säkerheten för blockchain-transaktioner.

”Valour förblir orubbligt i vårt åtagande att erbjuda investerare ett brett utbud av investeringsmöjligheter för digitala tillgångar”, säger Olivier Roussy Newton, VD för DeFi Technologies. ”Inkluderingen av dessa banbrytande ETPer i vår produktlinje understryker vårt engagemang för att leverera innovativa lösningar som uppfyller de växande behoven hos investerare i det digitala tillgångsområdet Vi är glada över att få täckning från vårt nyligen förvärvade dotterbolag, Reflexivity Research, för att sammanfalla med produktlanseringarna, vilket ger investerare värdefulla insikter och förbättrar deras förståelse för marknadslandskapet.

”Våra unika ETP-erbjudanden i Norden befäster vår ledande position som emittenten med det bredaste utbudet av produkter”, säger Johanna Belitz, Valours försäljningschef, Norden. ”När efterfrågan på altcoins ökar, förväntar vi oss ivrigt mottagandet av våra tre nya erbjudanden i regionen.”

Valour fortsätter att leda ansvaret för att driva innovation inom det digitala tillgångsområdet och utöka sitt produktutbud för att tillgodose de växande behoven hos investerare i Norden. Utöver Valour Toncoin (TON), Internet Computer (ICP) och Chainlink (LINK) ETPerna planerar Valour att introducera ett brett utbud av digitala tillgångsinvesteringsprodukter under de kommande månaderna, vilket ytterligare förbättrar tillgängligheten och bekvämligheten för traditionella investerare.

Handla Valours produkter

Valours produkter är europeiska börshandlade produkter som handlas på bland annat Nordic Growth Market.

Det betyder att det går att handla andelar i dessa ETPer genom de flesta svenska banker och Internetmäklare, till exempel DEGIRONordnet, Aktieinvest och Avanza

Fortsätt läsa

Nyheter

INSU ETF ger exponering mot amerikanska försäkringsbolag

Publicerad

den

Invesco Dow Jones US Insurance UCITS ETF Acc (INSU ETF), med ISIN-nummer IE0007UJ6IE0, försöker spåra Dow Jones U.S. Select Insurance-index. Dow Jones U.S. Select Insurance-index följer den amerikanska försäkringssektorn.

Invesco Dow Jones US Insurance UCITS ETF Acc (INSU ETF), med ISIN-nummer IE0007UJ6IE0, försöker spåra Dow Jones U.S. Select Insurance-index. Dow Jones U.S. Select Insurance-index följer den amerikanska försäkringssektorn.

Denna börshandlade fonds TER (total cost ratio) uppgår till 0,35 % p.a. Invesco Dow Jones US Insurance UCITS ETF Acc är den enda ETF som följer Dow Jones U.S. Select Insurance-index. ETFen replikerar det underliggande indexets prestanda genom full replikering (köper alla indexbeståndsdelar). Utdelningarna i ETFen ackumuleras och återinvesteras i den börshandlade fonden.

Denna ETF lanserades den 10 juli 2023 och har sin hemvist i Irland.

Produktbeskrivning

Invesco Dow Jones US Insurance UCITS ETF Acc syftar till att uppnå den totala nettoavkastningen för Dow Jones U.S. Select Insurance Index (”Referensindexet”), minus påverkan av avgifter.

Referensindex är ett börsvärdevägt index som representerar resultatet för stora, medelstora och små försäkringsbolag på den amerikanska marknaden. Referensindexet är konstruerat från Dow Jones U.S. Broad Stock Market Index (”Moderindex”) genom att använda indexleverantörens kriterier för att inkludera värdepapper som klassificeras som Full Line Insurance, Property & Casualty Insurance och Livförsäkringsbolag enligt S&P Dow Jones industriklassificeringssystem. Värdepapper måste också ha ett floatjusterat börsvärde på minst 500 miljoner USD för att komma in i referensindexet och minst 250 miljoner USD för att vara kvar i referensindexet.

Fonden strävar efter att uppnå sitt mål genom att köpa och hålla, så långt det är möjligt och praktiskt, alla värdepapper i referensindex i sina respektive vikter. Fonden kommer att sträva efter att balansera om sina innehav i linje med förändringar i referensindexet, som ombalanseras på kvartalsbasis.

Denna ETF hanteras passivt.

Handla INSU ETF

Invesco Dow Jones US Insurance UCITS ETF Acc (INSU ETF) är en börshandlad fond (ETF) som handlas på London Stock Exchange.

London Stock Exchange är en marknad som få svenska banker och nätmäklare erbjuder access till, men DEGIRO gör det.

Börsnoteringar

BörsValutaKortnamn
London Stock ExchangeGBXINSX
London Stock ExchangeUSDINSU

Största innehav

NamnISINVikt %
CHUBB LTD CHF24.15CH004432874511.56%
PROGRESSIVE CORP USD1US743315103910.28%
ARTHUR J GALLAGHER & CO USD1US36357610976.65%
AMERICAN INTERNATIONAL GROUP USD2.5US02687478496.06%
TRAVELERS COS INC/THE NPVUS89417E10915.36%
METLIFE INC USD0.01US59156R10864.93%
PRUDENTIAL FINANCIAL INC USD0.01US74432010224.75%
AFLAC INC USD0.1US00105510284.75%
ALLSTATE CORP USD0.01US02000210144.16%
ARCH CAPITAL GROUP LTD USD0.01BMG0450A10534.14%

Innehav kan komma att förändras

Fortsätt läsa

Nyheter

Crypto Market Compass | 13. May 2024

Publicerad

den

Crypto Market Compass | 13. May 2024 Bitcoin continues to consolidate above 60k USD as the market is gradually entering dull seasonality from June onwards

• Bitcoin continues to consolidate above 60k USD as the market is gradually entering dull seasonality from June onwards

• Our in-house “Cryptoasset Sentiment Indicator” continues to hover around neutral levels in sentiment

• Unprofitable BTC miners are coming under pressure following the Halving judging by the recent decline in network hash rate

Chart of the Week

Performance

Last week, cryptoassets underperformed traditional financial assets like equities or Gold as Bitcoin continued to consolidate above 60k USD.

It appears as if the market is currently lacking new positive catalysts after the US and Hong Kong spot ETF approvals and the Bitcoin Halving. Moreover, we are gradually entering dull seasonality from June onwards as the summer months have historically shown below-average returns for Bitcoin in the past.

Moreover, increasing US recession risks towards the summer as outlined in our latest monthly report could provide a temporary headwind for Bitcoin and cryptoassets as our own analyses still imply that Bitcoin’s performance continues to be dominated by global growth expectations.

Our base case is that the market continues to consolidate until macro risks have cleared/materialized and the positive performance effects from the Halving start to kick in around August 2024 as outlined in our special report about the Halving.

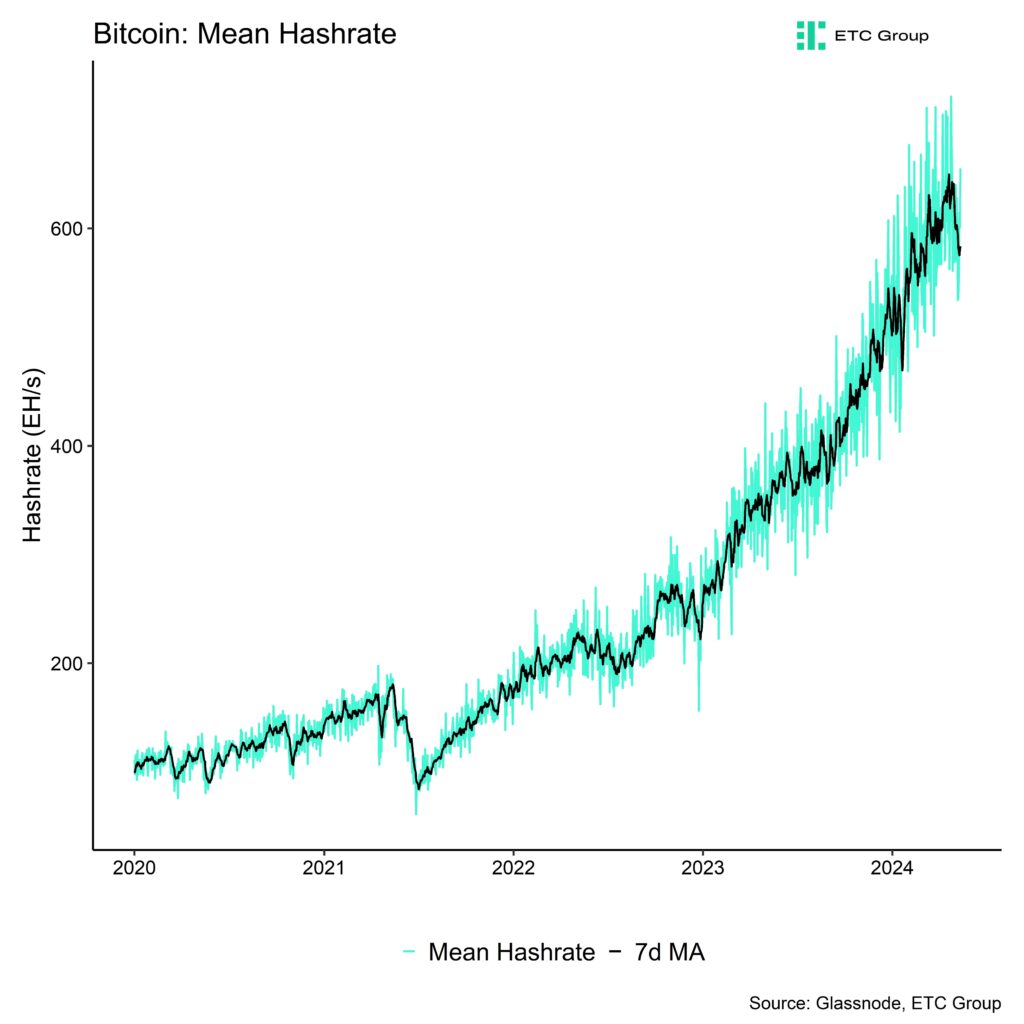
In the meantime, unprofitable BTC miners could come under pressure and there seems to be first evidence of that happening judging by the recent decline in network hash rate (Chart-of-the-Week). More specifically, the 7-day moving average of
Bitcoin’s hash rate has already declined by around -8% since the Halving took place on the 20 th of April.

In addition, last week also saw the 4th negative difficulty adjustment this year as it took BTC miners on average longer than 10 minutes to find the correct hash for a block. This is additional evidence that the network hash rate has been reduced.

In fact, the average BTC miner’s revenue has declined significantly as both the block subsidy and transaction fees have declined significantly since the Halving. Daily aggregate miner revenues have dropped to around ~28 mn USD, down from ~72 mn USD at the time of the Halving. That being said, there is no sign of significant distribution of bitcoins by BTC miners yet based on aggregate BTC miner balances.

There have been no significant transfers from miner wallets to exchange wallets either more recently.

Increasing selling pressure by BTC miners could be a headwind in the short term.

Furthermore, selling pressure could also materialize via fund outflows from crypto ETPs as traditional investors could distribute some of their crypto holdings for liquidity reasons in case of increasing US recession risks mentioned above.

This is something that we will continue to monitor over the coming weeks.

On a positive note, overall exchange inflows that are usually a good barometer for overall selling pressure have abated more recently and neither short- nor long-term holders are currently distributing coins in a significant way. Besides, global crypto ETPs still saw net inflows overall over the past week despite ongoing GBTC outflows in the US.

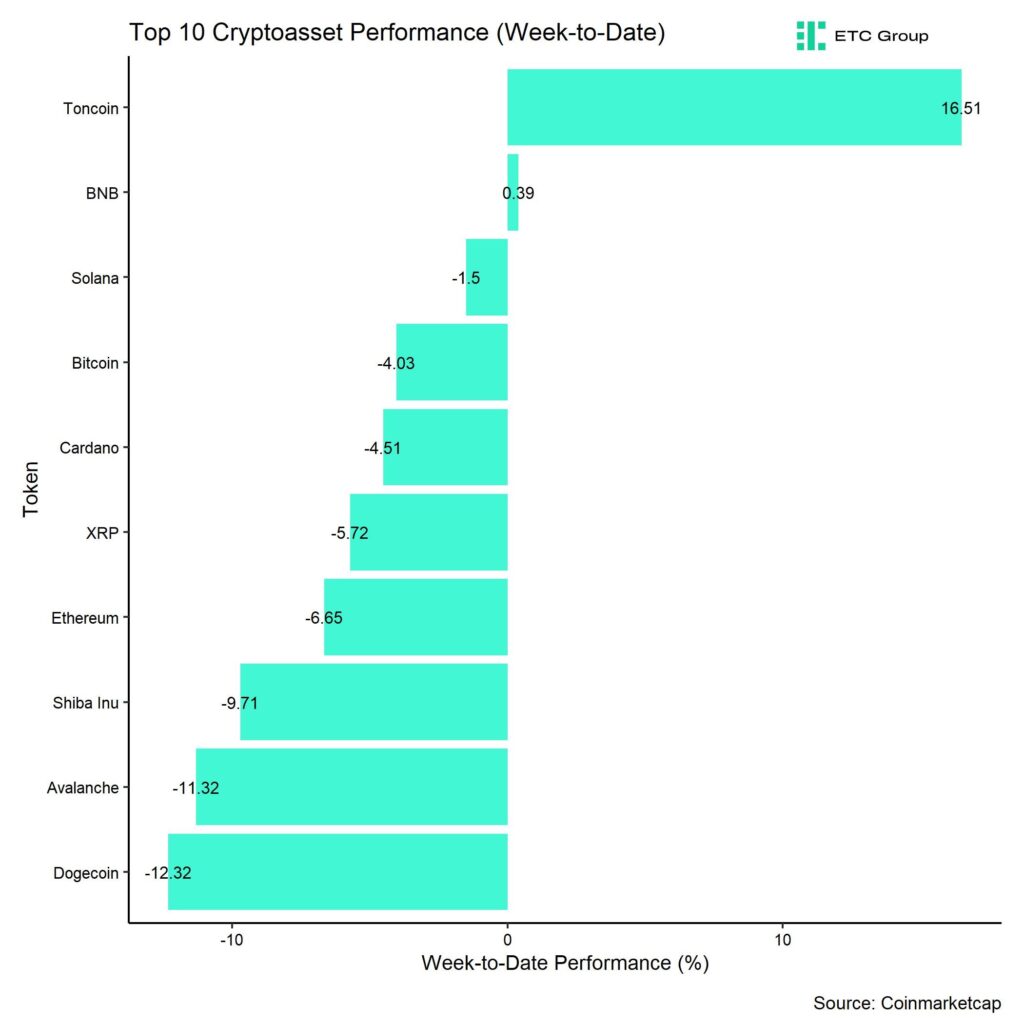
In general, among the top 10 crypto assets, Toncoin, BNB, and Solana were the relative outperformers.

However, overall altcoin outperformance vis-à-vis Bitcoin remained relatively low, with only around 40% of our tracked altcoins managing to outperform Bitcoin on a weekly basis.

Sentiment

Our in-house “Cryptoasset Sentiment Index” continues to hover around neutral levels in sentiment. The more recent correction has only led to a slight decrease in sentiment so far.

At the moment, 5 out of 15 indicators are above their short-term trend.

Last week, there were significant reversals to the downside in global crypto ETP fund flows and the Crypto Fear & Greed Index.

That being said, the Crypto Fear & Greed Index still signals ”Greed” again as of this morning.

Performance dispersion among cryptoassets has continued to remain low.

Altcoin outperformance vis-à-vis Bitcoin was still subdued, with around 40% of our tracked altcoins that have outperformed Bitcoin on a weekly basis. At the same time, Ethereum continued to underperform Bitcoin last week.

In general, increasing (decreasing) altcoin outperformance tends to be a sign of increasing (decreasing) risk appetite within cryptoasset markets.

Meanwhile, sentiment in traditional financial markets remains relatively elevated, judging by our own measure of Cross Asset Risk Appetite (CARA).

Fund Flows

Last week, we saw a slight reversal in global crypto ETPs with around +25.7 mn USD in net inflows, up from around -372.4 mn USD the week prior based on Bloomberg data.

Global Bitcoin ETPs saw net inflows of +92.5 mn USD of which +117.0 mn (net) were related to US spot Bitcoin ETFs alone. Hong Kong spot Bitcoin ETFs already experienced net outflows of around -40.9 mn USD last week according to data provided by Bloomberg.

The ETC Group Physical Bitcoin ETP (BTCE) also saw net outflows equivalent to -33.4 mn USD while the ETC Group Core Bitcoin ETP (BTC1) saw minor net inflows of +0.7 mn USD last week.

The Grayscale Bitcoin Trust (GBTC) continued to experience net outflows of approximately -171.1 mn USD last week while other major US spot Bitcoin ETFs were able to attract new capital, e.g. iShares’ IBIT with net inflows of around +48.2 mn USD.

In contrast to Bitcoin ETPs, Global Ethereum ETPs saw a decline in ETP flows last week, with net outflows of around -63.5 mn USD. This was mostly due to significant outflows from Hong Kong spot Ethereum ETFs that saw -46.5 mn USD in net outflows last week, according to data provided by Bloomberg.

In general, there seems to be an emerging pattern in crypto ETP fund flows that while global Bitcoin ETP flows continue to be dominated by US spot Bitcoin ETF flows, global Ethereum ETP fund flows are increasingly dominated by Hong Kong spot Ethereum ETF flows.

Meanwhile, the ETC Group Physical Ethereum ETP (ZETH) saw neither in- nor outflows (+/- 0 mn USD). The ETC Group Ethereum Staking ETP (ET32) experienced some net outflows (-1.5 mn USD) last week.

Besides, Altcoin ETPs ex Ethereum experienced only minor net inflows of around +5.7 mn USD last week.

Besides, Thematic & basket crypto ETPs experienced some net outflows of -9.0 mn USD, based on our calculations. The ETC Group MSCI Digital Assets Select 20 ETP (DA20) did experience neither in- nor outflows last week (+/- 0 mn USD).

Besides, the beta of global crypto hedge funds to Bitcoin over the last 20 trading days continued to increase to around 1.06. This implies that global crypto hedge funds have significantly increased their market exposure and have currently a slightly more than neutral exposure to Bitcoin.

On-Chain Data

As the market has rebounded from oversold levels at the beginning of May, on-chain data for Bitcoin remain somewhat mixed.

As mentioned above, unprofitable BTC miners could come under pressure and there seems to be first evidence of that happening judging by the recent decline in network hash rate (Chart-of-the-Week).

More specifically, the 7-day moving average of Bitcoin’s hash rate has already declined by around -8% since the Halving took place on the 20th of April.

In this context, the decline in active addresses to year-to-date lows appears to be somewhat concerning. On a positive note, overall network activity based on a variety of metrics still implies that Bitcoin’s network activity is still near all-time highs as the transaction count remains relatively high. This is not related to high inscription demand but related to genuine transaction demand.

Coming to Bitcoin’s hash rate, last week also saw the 4th negative difficulty adjustment this year as it took BTC miners on average longer than 10 minutes to find the correct hash for a block. This is additional evidence that the network hash rate has been reduced.

In fact, the average BTC miner’s revenue has declined significantly as both the block subsidy and transaction fees have declined significantly since the Halving. Daily aggregate miner revenues have dropped to around ~28 mn USD, down from ~72 mn USD at the time of the Halving.

That being said, there is no sign of significant distribution of bitcoins by BTC miners yet based on aggregate BTC miner balances. There have been no significant transfers from miner wallets to exchange wallets either more recently.

Increasing selling pressure by BTC miners could be a headwind in the short term.
Meanwhile, the increase in accumulation activity observed last week has started to decelerate a bit but is still comparatively high. Furthermore, whales continue to take coins off exchange on a net basis.

However, intraday net buying minus selling volumes on spot Bitcoin exchanges remained negative over the past week largely due to the deceleration in US spot Bitcoin ETF net inflows since March.

A renewed improvement in net buying volumes on spot exchanges is highly dependent on a resumption of higher flows into US and global Bitcoin ETP flows.

Futures, Options & Perpetuals

Last week, both BTC futures and perpetual open interest saw a slight increase in BTC-terms which seems to be related to a net increase in short open interest. In other words, BTC futures traders have started building up more downside exposure over the past week.

Meanwhile, both BTC short and long futures liquidations remained relatively low last week. The Bitcoin futures basis continued to move sideways last week. At the time of writing, the Bitcoin futures annualized basis rate stands at around 8.7% p.a.
Perpetual funding rates also remained slightly positive throughout the week.

Bitcoin options’ open interest decreased slightly last week as BTC option traders seem to have reduced their exposure of puts relative to calls. Relative put-call volume ratios remained well behaved last week.

However, the 25-delta BTC 1-month option skew increased slightly implying an increased demand for puts relative to calls.

BTC option implied volatilities have decreased slightly compared to the prior week. Implied volatilities of 1-month ATM Bitcoin options are currently at around 51.9% p.a., down from 53.1% p.a. the week prior.

Bottom Line

• Bitcoin continues to consolidate above 60k USD as the market is gradually entering dull seasonality from June onwards

• Our in-house “Cryptoasset Sentiment Indicator” continues to hover around neutral levels in sentiment

• Unprofitable BTC miners are coming under pressure following the Halving judging by the recent decline in network hash rate

To read our Crypto Market Compass in full, please click the button below:

This is not investment advice. Capital at risk. Read the full disclaimer

© ETC Group 2019-2024 | All rights reserved

Fortsätt läsa

Populära